
 Nasdaq
 華爾街日報
華爾街日報3 Global Stocks That May Be Undervalued In January 2026
As we enter January 2026, global markets are navigating a complex landscape marked by mixed performances across major indices and geopolitical influences driving sector-specific gains. With U.S. pending home sales rising at the fastest pace in nearly three years and European markets hitting new highs, investors are increasingly focused on identifying undervalued opportunities that could offer potential value amidst these shifting conditions. Finding such stocks often involves looking for companies with strong fundamentals that may not be fully recognized by the market, offering a potential advantage in an otherwise volatile environment.
Top 10 Undervalued Stocks Based On Cash Flows
| Name | Current Price | Fair Value (Est) | Discount (Est) |
| Visional (TSE:4194) | ¥10035.00 | ¥19790.64 | 49.3% |
| Suzhou Zelgen Biopharmaceuticals (SHSE:688266) | CN¥99.90 | CN¥199.21 | 49.9% |
| Sino Medical Sciences Technology (SHSE:688108) | CN¥21.89 | CN¥43.47 | 49.6% |
| PeptiDream (TSE:4587) | ¥1735.50 | ¥3433.52 | 49.5% |
| Ottobock SE KGaA (XTRA:OBCK) | €69.50 | €138.74 | 49.9% |
| Nokian Panimo Oyj (HLSE:BEER) | €2.465 | €4.88 | 49.4% |
| Jæren Sparebank (OB:JAREN) | NOK383.55 | NOK759.10 | 49.5% |
| CURVES HOLDINGS (TSE:7085) | ¥798.00 | ¥1580.98 | 49.5% |
| ASE Technology Holding (TWSE:3711) | NT$274.00 | NT$539.22 | 49.2% |
| ArcticZymes Technologies (OB:AZT) | NOK22.90 | NOK45.44 | 49.6% |
Let's take a closer look at a couple of our picks from the screened companies.
Hanall Biopharma (KOSE:A009420)
Overview: Hanall Biopharma Co., Ltd. is a pharmaceutical company that manufactures and sells pharmaceutical products both in South Korea and internationally, with a market cap of ₩2.35 trillion.
Operations: Hanall Biopharma generates revenue through the manufacturing and sale of pharmaceutical products in both domestic and international markets.
Estimated Discount To Fair Value: 12.8%
Hanall Biopharma's recent financial performance shows promising signs, with net income turning positive at KRW 690.22 million for the first nine months of 2025, compared to a loss in the previous year. The stock is trading at ₩50,600, which is 12.8% below its estimated fair value of ₩58,048.36. Despite high share price volatility and a forecasted low return on equity of 11.6%, earnings are expected to grow significantly by 53.7% annually over the next three years.
- Upon reviewing our latest growth report, Hanall Biopharma's projected financial performance appears quite optimistic.
- Click here and access our complete balance sheet health report to understand the dynamics of Hanall Biopharma.
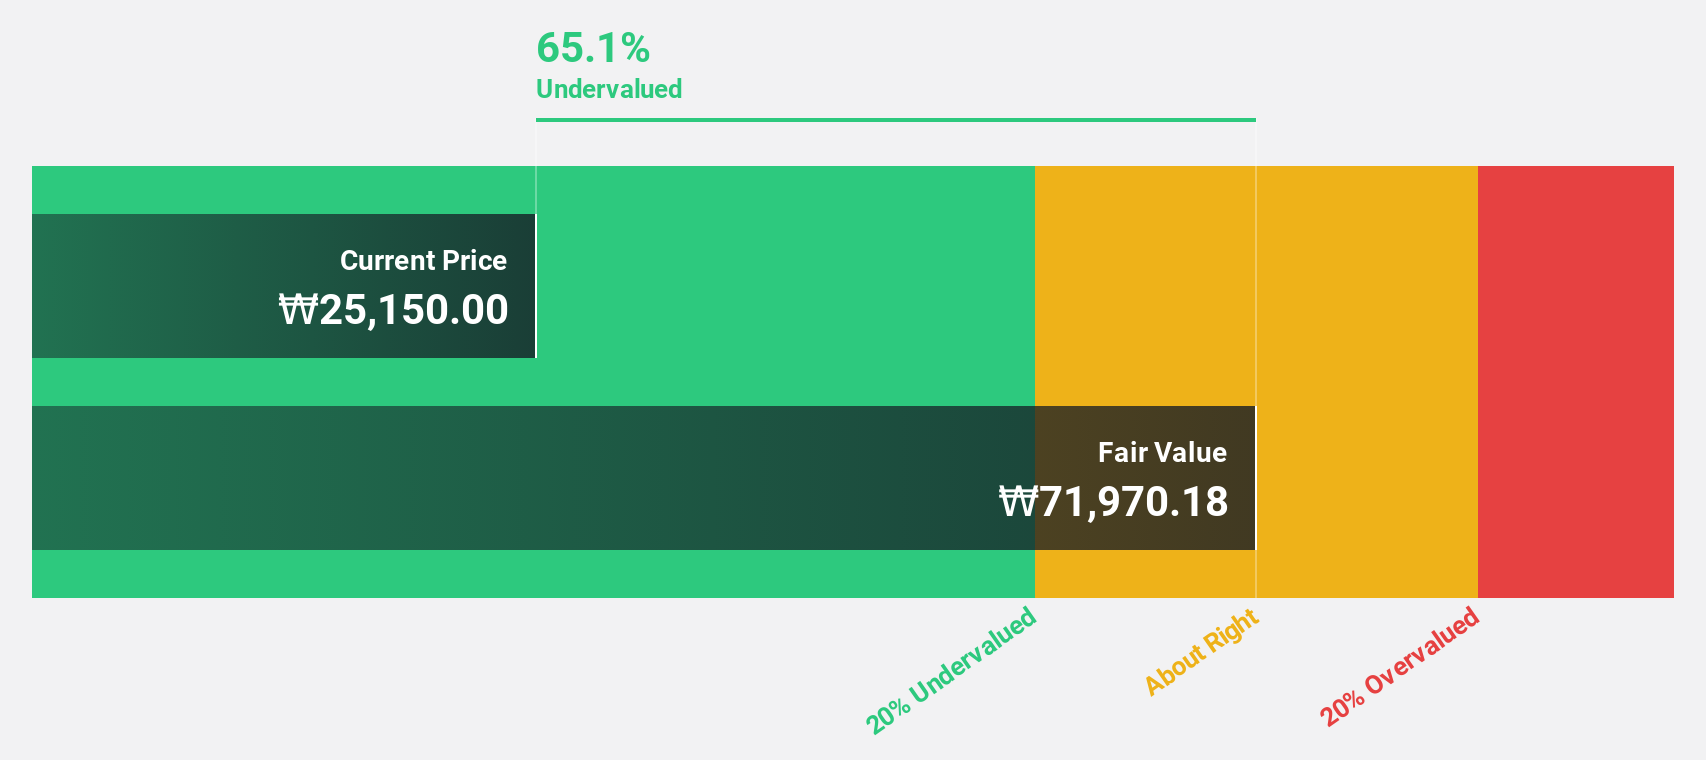
Suzhou Zelgen Biopharmaceuticals (SHSE:688266)
Overview: Suzhou Zelgen Biopharmaceuticals Co., Ltd. is involved in the research, development, manufacture, sale, and distribution of medicines in China and has a market cap of CN¥24.72 billion.
Operations: The company generates its revenue primarily from its pharmaceuticals segment, which amounts to CN¥742.28 million.
Estimated Discount To Fair Value: 49.9%
Suzhou Zelgen Biopharmaceuticals has shown strong revenue growth, with sales rising to CNY 593.44 million for the first nine months of 2025 from CNY 384.12 million a year earlier. Despite a net loss of CNY 93.42 million, the company is trading significantly below its estimated fair value of CN¥199.21 at CN¥99.9 per share and is projected to become profitable within three years, driven by expected annual revenue growth of 35.4%.
- The growth report we've compiled suggests that Suzhou Zelgen Biopharmaceuticals' future prospects could be on the up.
- Click here to discover the nuances of Suzhou Zelgen Biopharmaceuticals with our detailed financial health report.
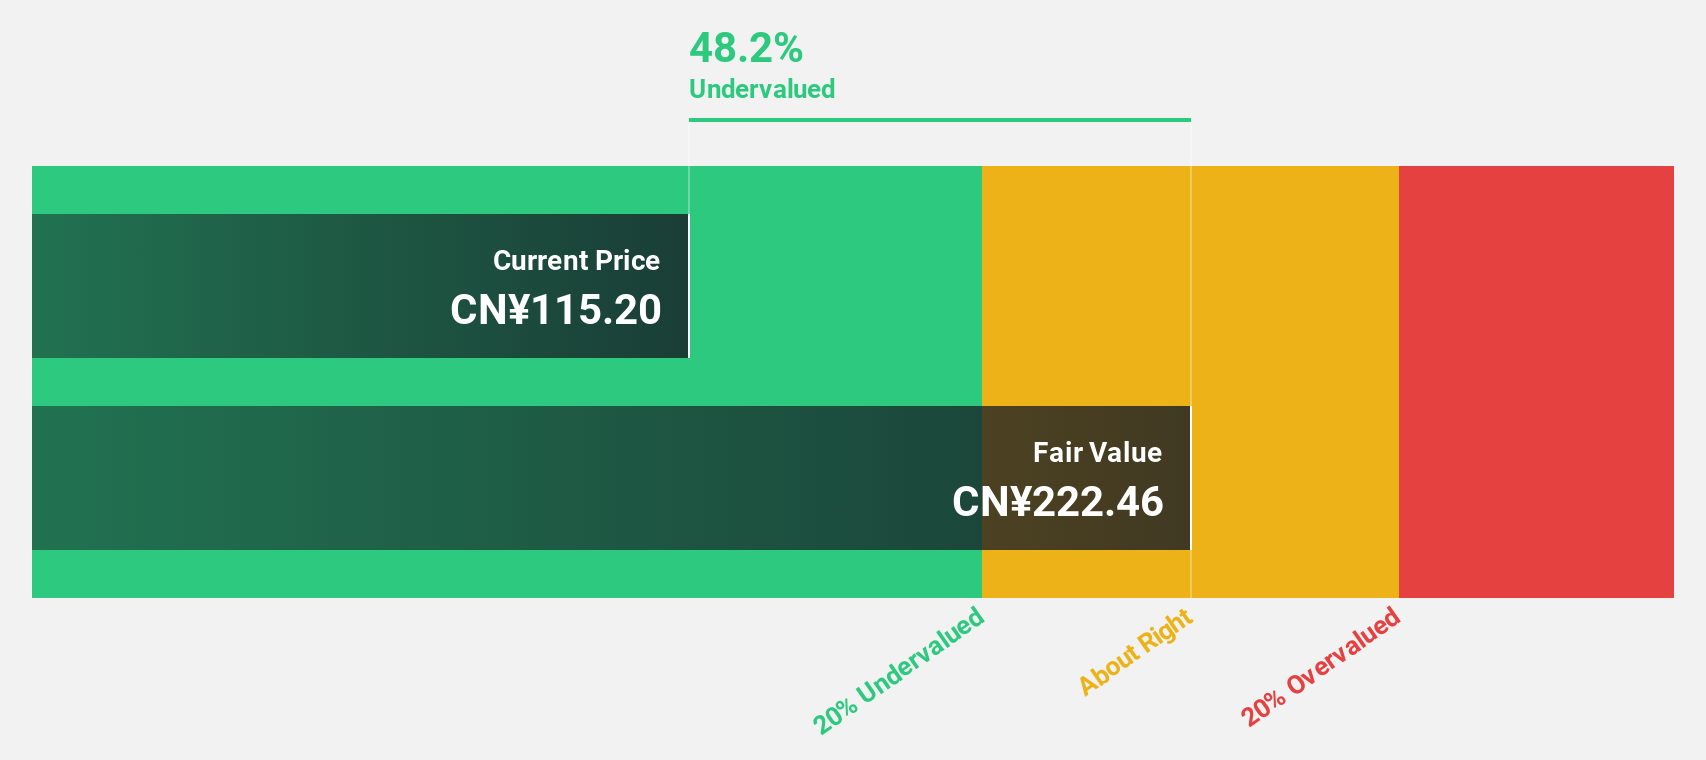
Silergy (TWSE:6415)
Overview: Silergy Corp. designs, manufactures, and sells integrated circuit products and provides related technical services in China and internationally, with a market cap of NT$80.09 billion.
Operations: The company generates revenue of NT$18.53 billion from its semiconductor segment.
Estimated Discount To Fair Value: 34%
Silergy is trading at NT$227, significantly below its estimated fair value of NT$344.17, suggesting undervaluation based on cash flows. Despite recent quarterly sales and net income declines compared to the previous year, earnings are expected to grow significantly at 33.7% annually over the next three years, outpacing the TW market's growth rate. However, revenue growth is forecasted at a moderate 15.5% per year with a low future return on equity of 13.7%.
- Insights from our recent growth report point to a promising forecast for Silergy's business outlook.
- Dive into the specifics of Silergy here with our thorough financial health report.
Key Takeaways
- Delve into our full catalog of 483 Undervalued Global Stocks Based On Cash Flows here.
- Are any of these part of your asset mix? Tap into the analytical power of Simply Wall St's portfolio to get a 360-degree view on how they're shaping up.
- Maximize your investment potential with Simply Wall St, the comprehensive app that offers global market insights for free.
Want To Explore Some Alternatives?
- Explore high-performing small cap companies that haven't yet garnered significant analyst attention.
- Diversify your portfolio with solid dividend payers offering reliable income streams to weather potential market turbulence.
- Fuel your portfolio with companies showing strong growth potential, backed by optimistic outlooks both from analysts and management.
This article by Simply Wall St is general in nature. We provide commentary based on historical data and analyst forecasts only using an unbiased methodology and our articles are not intended to be financial advice. It does not constitute a recommendation to buy or sell any stock, and does not take account of your objectives, or your financial situation. We aim to bring you long-term focused analysis driven by fundamental data. Note that our analysis may not factor in the latest price-sensitive company announcements or qualitative material. Simply Wall St has no position in any stocks mentioned.
Have feedback on this article? Concerned about the content? Get in touch with us directly. Alternatively, email editorial-team@simplywallst.com