
 Nasdaq
 華爾街日報
華爾街日報Is It Too Late To Consider Macy's (M) After A 49% One Year Rally?
- If you are wondering whether Macy's current share price still lines up with the underlying business, this article walks through what the numbers are saying about value right now.
- Macy's shares last closed at US$23.22, with reported returns of 4.9% over 7 days, 1.6% over 30 days, 2.1% year to date, 48.8% over 1 year and 113.0% over 5 years. This naturally raises questions about how much of the story might already be reflected in the price.
- Recent headlines have focused on the company as a traditional department store player at a time when investors are paying close attention to how retailers are positioning themselves. This wider conversation about the role of department stores gives extra context when you look at how strongly the stock has moved over the last few years.
- On Simply Wall St's 6 point valuation checklist, Macy's currently scores 4 out of 6. Next we will look at what different valuation approaches say about that score, along with a final section on a broader way to think about valuation beyond a single number.
Approach 1: Macy's Discounted Cash Flow (DCF) Analysis
A Discounted Cash Flow, or DCF, model estimates what a company could be worth today by projecting its future cash flows and discounting them back to the present using a required return.
For Macy's, the model uses a 2 Stage Free Cash Flow to Equity approach, starting from last twelve months free cash flow of about $678.0 million. Analyst inputs and further projections suggest free cash flow figures stepping through the next decade, including an estimate of $686 million in 2028, with later years extrapolated by Simply Wall St rather than based on explicit analyst forecasts.
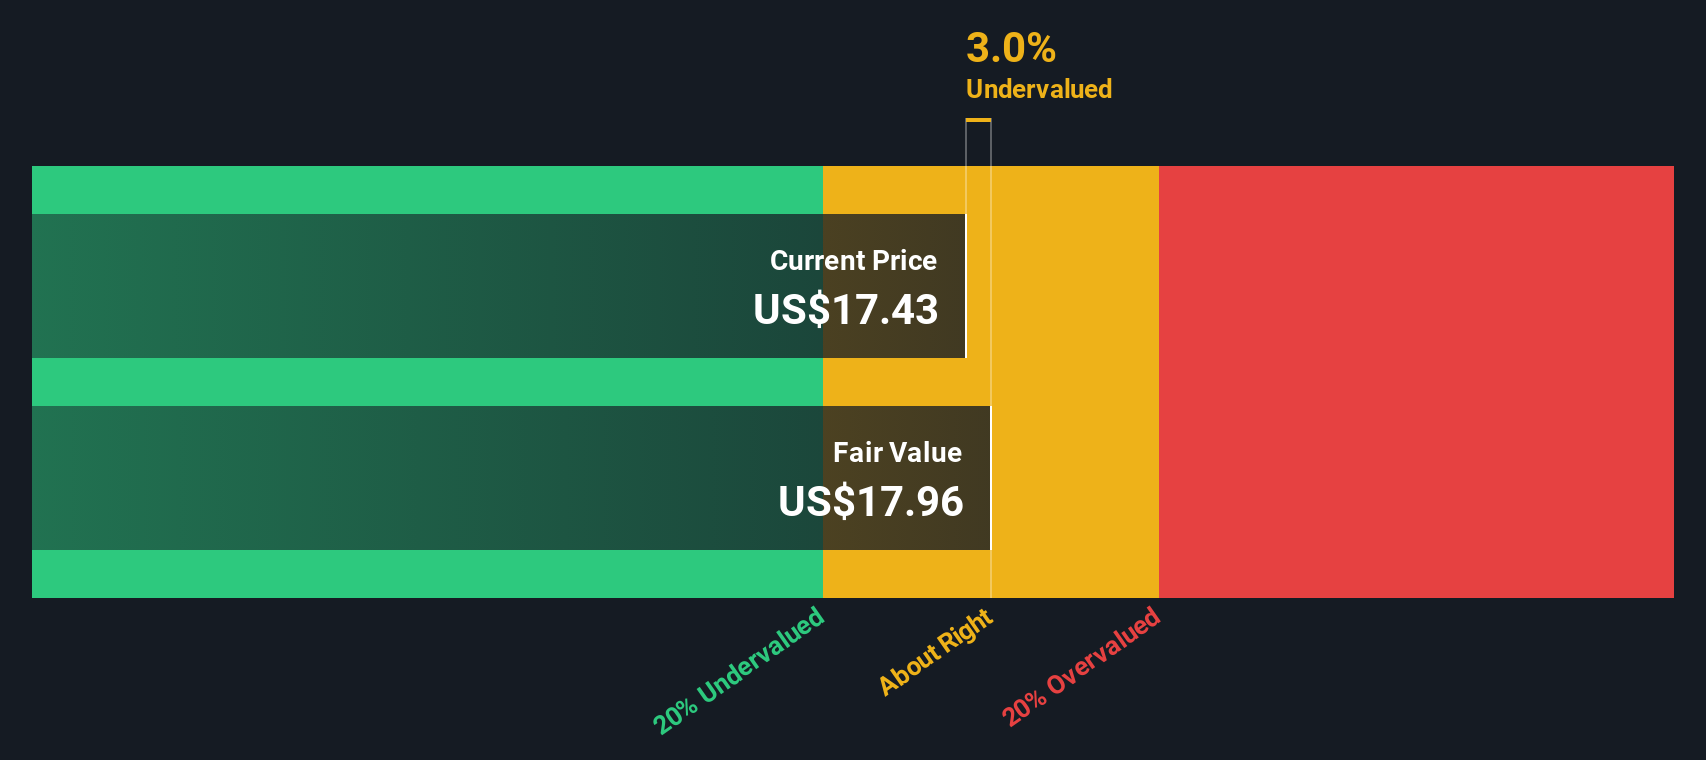
When all of those projected cash flows are discounted back and combined, the model arrives at an estimated intrinsic value of about $27.46 per share. Compared to the recent share price of US$23.22, this indicates a 15.4% discount. Under this particular approach, Macy's appears to be trading below the model’s estimate of fair value.
Result: UNDERVALUED
Our Discounted Cash Flow (DCF) analysis suggests Macy's is undervalued by 15.4%. Track this in your watchlist or portfolio, or discover 873 more undervalued stocks based on cash flows.
Approach 2: Macy's Price vs Earnings
For profitable companies like Macy's, the P/E ratio is a straightforward way to relate what you pay for each share to the earnings that company is currently generating. It gives you a quick sense of how many dollars investors are paying for each dollar of earnings.
What counts as a "normal" or "fair" P/E usually reflects how the market views a company’s growth prospects and risk. Higher expected growth and lower perceived risk often come with a higher P/E, while slower growth or higher risk tends to support a lower P/E.
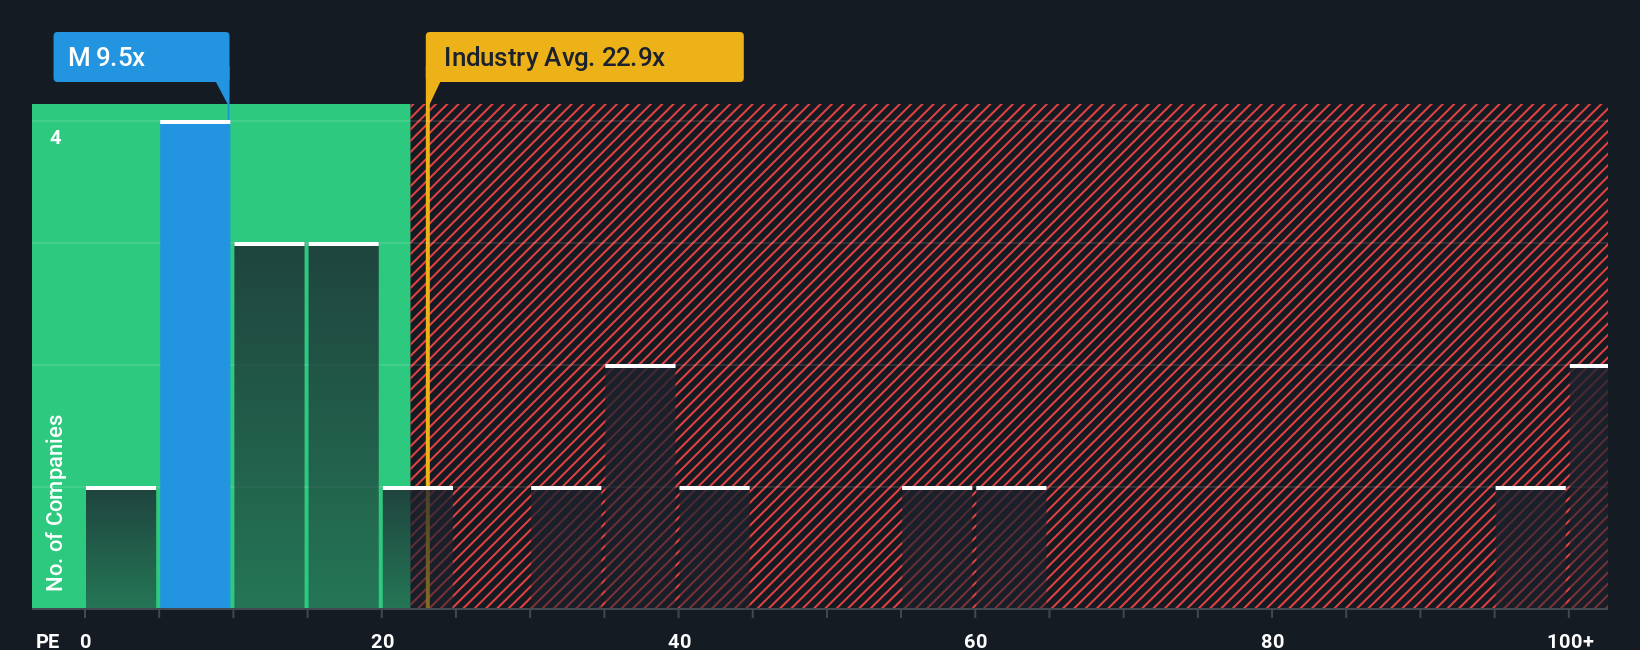
Macy's currently trades on a P/E of 12.94x. That sits below the Multiline Retail industry average P/E of 19.42x and also below the peer average of 22.81x. Simply Wall St’s Fair Ratio for Macy's is 15.88x, which is its proprietary estimate of an appropriate P/E given factors like earnings growth, industry, profit margin, market cap and specific risks. Because it ties the multiple to Macy's own characteristics rather than just broad peer groups, the Fair Ratio can be more tailored than a simple industry or peer comparison. With the Fair Ratio above the current 12.94x, this framework points to the shares trading below that reference level.
Result: UNDERVALUED
P/E ratios tell one story, but what if the real opportunity lies elsewhere? Discover 1450 companies where insiders are betting big on explosive growth.
Upgrade Your Decision Making: Choose your Macy's Narrative
Earlier we mentioned that there is an even better way to understand valuation, so let us introduce you to Narratives. Narratives are simply your story about Macy's linked to a financial forecast and a fair value. On Simply Wall St's Community page you can use them to set your own assumptions for future revenue, earnings and margins, compare the fair value that results from that story with the current price to help inform your decisions, see those Narratives update automatically when new earnings or news arrive, and even contrast very different views. One investor might focus on Macy's real estate, digital sales of more than US$7b and plans to raise between US$600m and US$750m from property sales, resulting in a fair value of US$24.43. Another might use analyst-style assumptions around omni channel investments, margin pressures and share buybacks, leading to a fair value of US$21.80.
For Macy's however we will make it really easy for you with previews of two leading Macy's Narratives:
Fair value: US$24.43 per share
Gap to fair value: 4.9% discount versus the US$23.22 last close
Revenue growth assumption: 5.57%
- Macy's owns a sizeable real estate portfolio and the narrative centers on using planned sales of about US$600m to US$750m over three years to bring in liquidity, reduce debt and support new investments.
- With more than US$7b in annual digital sales, Macy's is framed as a large e commerce player that can further monetize online traffic through a growing media network.
- The bear side of this narrative highlights years of store closures and turnaround efforts, the risk that no takeover bid arrives, and a long run pattern of lower sales and profit margins that are not expected to return to historical highs.
Fair value: US$21.80 per share
Gap to fair value: 6.5% premium versus the US$23.22 last close
Revenue growth assumption: 4.99% annual decline
- This narrative leans on analyst work that ties Macy's outlook to omni channel investments, store optimization and supply chain upgrades, with an eye on how these could influence customer satisfaction, efficiency and margins.
- It sets out detailed assumptions on future revenues, earnings, profit margins, share count and P/E multiples that would line up with an analyst consensus price target of about US$14.77, framed as close to the share price used in that analysis.
- The risk section focuses on pressures from e commerce rivals, tariffs, discretionary spending swings, store closures and the challenge of attracting younger, digital first consumers, all of which could affect sales, margins and the ability to meet those analyst assumptions.
Side by side, these two Narratives give you a clear range of views on Macy's fair value and business direction so you can decide which story lines up more closely with your own expectations before you act.
Curious how numbers become stories that shape markets? Explore Community Narratives
Do you think there's more to the story for Macy's? Head over to our Community to see what others are saying!

This article by Simply Wall St is general in nature. We provide commentary based on historical data and analyst forecasts only using an unbiased methodology and our articles are not intended to be financial advice. It does not constitute a recommendation to buy or sell any stock, and does not take account of your objectives, or your financial situation. We aim to bring you long-term focused analysis driven by fundamental data. Note that our analysis may not factor in the latest price-sensitive company announcements or qualitative material. Simply Wall St has no position in any stocks mentioned.
Have feedback on this article? Concerned about the content? Get in touch with us directly. Alternatively, email editorial-team@simplywallst.com