
 Nasdaq
 華爾街日報
華爾街日報Assessing G2 Goldfields (TSX:GTWO) Valuation After High-Grade OKO Drill Results And Expanded Exploration Campaign
G2 Goldfields (TSX:GTWO) has put fresh drill results from its OKO Project in Guyana in front of investors, highlighting high-grade gold mineralisation, a larger drill campaign with five rigs, and ongoing greenfields exploration.
See our latest analysis for G2 Goldfields.
These fresh OKO drill results arrive after a strong run in the shares, with a 30-day share price return of 48.47% and a 90-day share price return of 64.25%. The 1-year total shareholder return is very large and today’s share price sits at CA$6.80, pointing to momentum that investors appear to be linking to perceived growth potential and changing views on project risk.
If this kind of resource news has your attention, it could be a good time to widen your search and check out fast growing stocks with high insider ownership.
With CA$6.80 on the screen after a very strong 1 year return and the shares trading at roughly an 18% discount to the latest analyst price target, you have to ask: is there still a buying opportunity here, or is the market already pricing in future growth?
Price to Book of 17.2x: Is it justified?
On a P/B of 17.2x at a CA$6.80 share price, G2 Goldfields sits well above both its peer group and the wider Canadian Metals and Mining industry.
P/B compares the market value of the company to its net assets, which is a common yardstick for early stage resource names that are not yet profitable. For G2 Goldfields, this means investors are paying a high multiple of the company’s book value despite it reporting a net loss of CA$11.40m and very modest revenue of CA$684K.
That high P/B suggests the market is placing a substantial premium on the OKO project and future revenue potential rather than current earnings or asset values. Relative to the Canadian Metals and Mining industry average of 3.1x, and even a peer average of 7.8x, the 17.2x multiple is aggressively higher, pointing to expectations that are materially above what the balance sheet alone would justify.
See what the numbers say about this price — find out in our valuation breakdown.
Result: Price-to-book of 17.2x (OVERVALUED)
However, the current premium sits against very modest CA$684K revenue and a CA$11.40m net loss, so any disappointment in OKO drilling or funding progress could quickly hit sentiment.
Find out about the key risks to this G2 Goldfields narrative.
Another View: DCF Points the Other Way
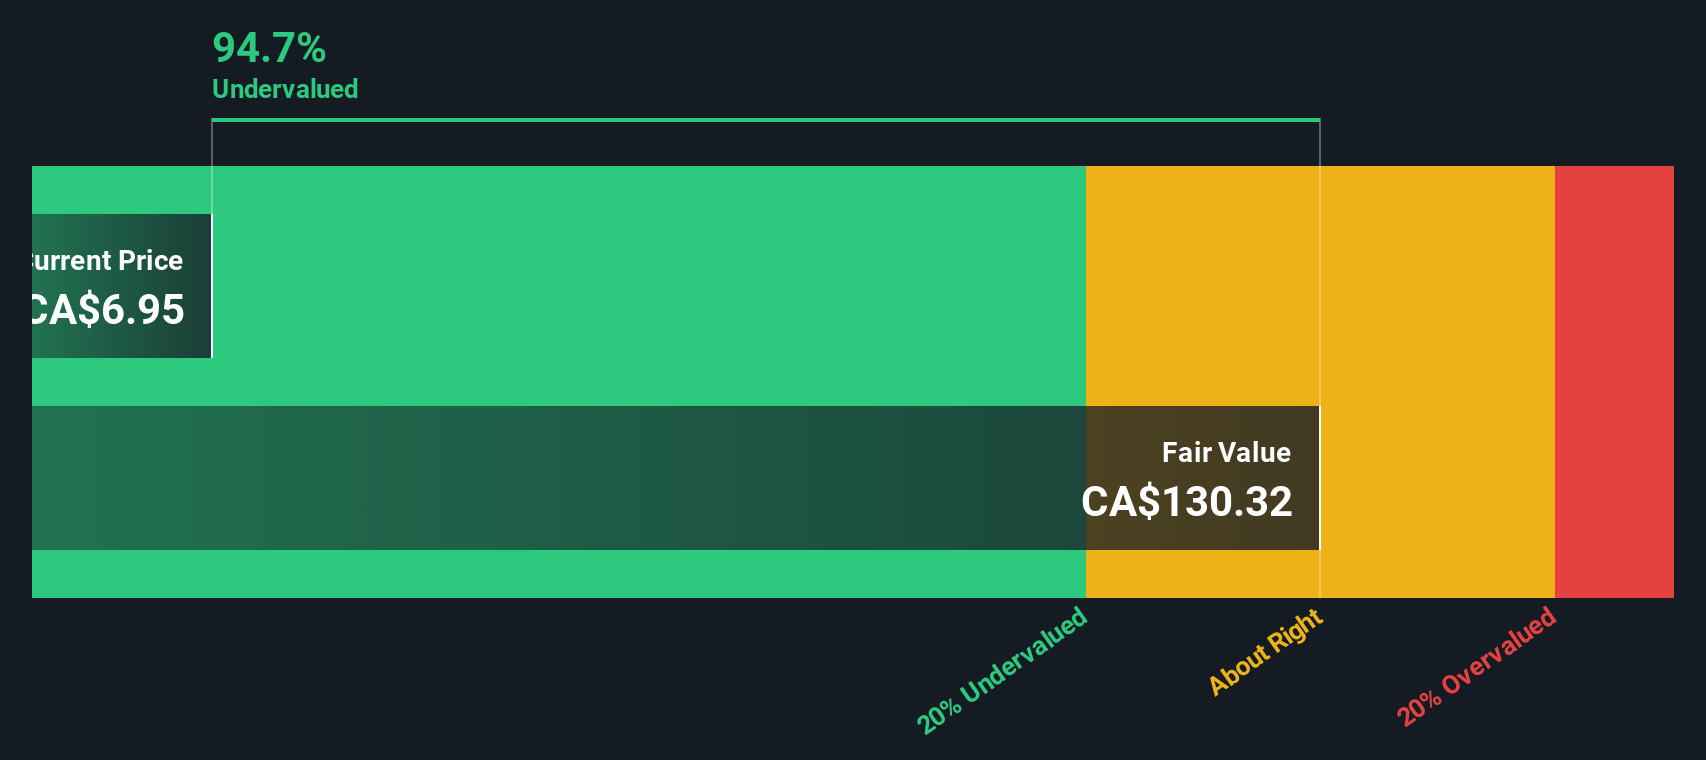
While the 17.2x P/B ratio suggests G2 Goldfields is expensive relative to book value, our DCF model paints a very different picture. On that framework, the shares at CA$6.80 are trading well below an estimated fair value of CA$129.99, which looks extremely optimistic compared to current fundamentals.
This kind of gap can cut both ways. If the assumptions behind the DCF prove too rich, investors leaning on it could be taking on more risk than they think. If they are closer to reality, is the P/B signal being too cautious?
Look into how the SWS DCF model arrives at its fair value.
Simply Wall St performs a discounted cash flow (DCF) on every stock in the world every day (check out G2 Goldfields for example). We show the entire calculation in full. You can track the result in your watchlist or portfolio and be alerted when this changes, or use our stock screener to discover 877 undervalued stocks based on their cash flows. If you save a screener we even alert you when new companies match - so you never miss a potential opportunity.
Build Your Own G2 Goldfields Narrative
If you see the numbers differently or want to stress test your own assumptions, you can build a customised view of G2 Goldfields in just a few minutes, starting with Do it your way.
A great starting point for your G2 Goldfields research is our analysis highlighting 2 key rewards and 2 important warning signs that could impact your investment decision.
Looking for more investment ideas?
If G2 Goldfields has sparked your interest, do not stop here, widen your watchlist now and give yourself more options before the next move.
- Spot potential bargains early by scanning these 877 undervalued stocks based on cash flows that are priced below what their cash flows may support.
- Ride powerful technology trends by zeroing in on these 25 AI penny stocks that are tied to artificial intelligence themes.
- Add some higher risk, higher potential names to your radar with these 3553 penny stocks with strong financials that already have financials to review.
This article by Simply Wall St is general in nature. We provide commentary based on historical data and analyst forecasts only using an unbiased methodology and our articles are not intended to be financial advice. It does not constitute a recommendation to buy or sell any stock, and does not take account of your objectives, or your financial situation. We aim to bring you long-term focused analysis driven by fundamental data. Note that our analysis may not factor in the latest price-sensitive company announcements or qualitative material. Simply Wall St has no position in any stocks mentioned.
Have feedback on this article? Concerned about the content? Get in touch with us directly. Alternatively, email editorial-team@simplywallst.com