
 Nasdaq
 華爾街日報
華爾街日報Taking A Fresh Look At Tenet Healthcare (THC) Valuation After A Mixed Earnings Beat
Earnings trigger and immediate stock reaction
Tenet Healthcare (THC) shares came under pressure after the company reported quarterly results that exceeded revenue and EPS expectations, yet ranked as the weakest performance versus estimates and the slowest revenue growth among hospital chain peers.
See our latest analysis for Tenet Healthcare.
At a share price of $208.24, Tenet Healthcare has seen short term momentum soften slightly over the past month. Its 1-year total shareholder return of 61.68% and very large 5-year total shareholder return signal that longer term holders have been strongly rewarded, even with the recent pullback after earnings as investors reassess growth prospects and risks around labor costs and reimbursement.
If this earnings reaction has you reviewing the wider sector, it could be a good moment to see how Tenet stacks up against other healthcare stocks that might fit your watchlist next.
With Tenet reporting 3.9% annual revenue growth and an intrinsic value model indicating a 44.6% discount to the current share price, investors may question whether this reflects a genuine opportunity or whether the market is already pricing in potential future growth.
Price-to-Earnings of 13.5x: Is it justified?
Tenet Healthcare closed at $208.24, and on a P/E of 13.5x that price sits well below both peer and industry averages, which points to an apparently discounted earnings valuation.
The P/E ratio tells you how much investors are currently paying for each dollar of earnings, and for a large, profitable healthcare operator this is a widely watched yardstick. With Tenet described as having high quality earnings and trading at what is labelled as good value, the current multiple suggests the market is not assigning a premium to its profit profile.
Tenet is flagged as good value versus peers, with its 13.5x P/E compared to a peer average of 24.9x and a US Healthcare industry average of 23.3x, a sizeable gap. It is also described as cheap relative to an estimated fair P/E of 22.8x, a level the market could move toward if sentiment on its earnings strength and cash generation improves.
Explore the SWS fair ratio for Tenet Healthcare
Result: Price-to-Earnings of 13.5x (UNDERVALUED)
However, this apparent discount sits alongside real pressure points, including labor and reimbursement risks, that could keep the P/E gap to peers wider than bulls might expect.
Find out about the key risks to this Tenet Healthcare narrative.
Another view on Tenet's value
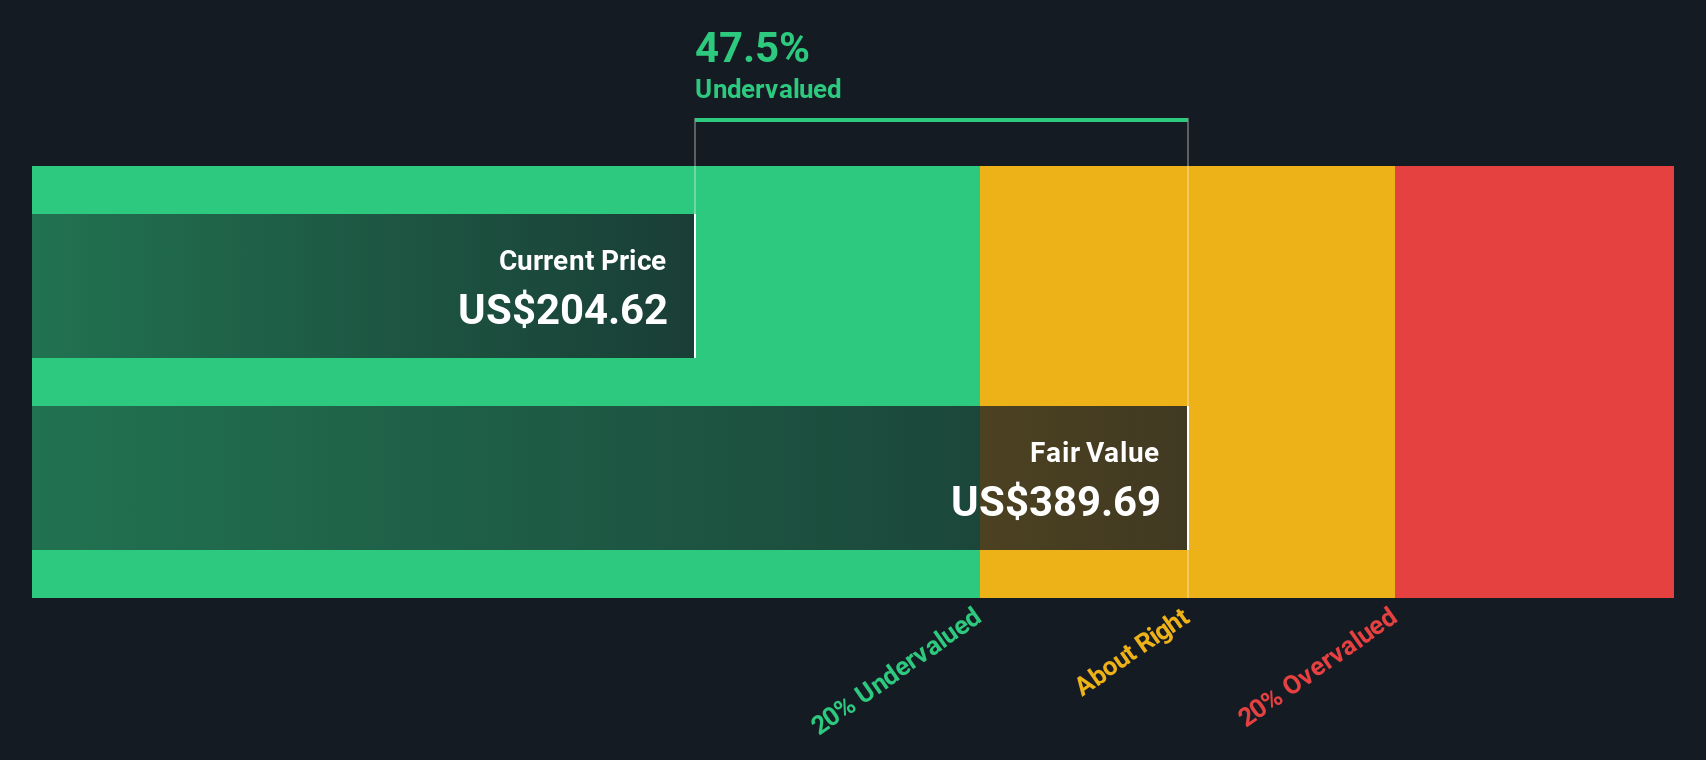
While the current 13.5x P/E points to an apparently cheap earnings multiple, our DCF model presents a different perspective on value. With Tenet at $208.24 versus an estimated fair value of $375.99, the model flags the shares as significantly undervalued. This raises a simple question: what is the market worried about that the model is not?
Look into how the SWS DCF model arrives at its fair value.
Simply Wall St performs a discounted cash flow (DCF) on every stock in the world every day (check out Tenet Healthcare for example). We show the entire calculation in full. You can track the result in your watchlist or portfolio and be alerted when this changes, or use our stock screener to discover 877 undervalued stocks based on their cash flows. If you save a screener we even alert you when new companies match - so you never miss a potential opportunity.
Build Your Own Tenet Healthcare Narrative
If you see the numbers differently or want to stress test your own view using the same data, you can build a custom thesis in minutes by using Do it your way.
A great starting point for your Tenet Healthcare research is our analysis highlighting 2 key rewards and 3 important warning signs that could impact your investment decision.
Ready for more investment ideas?
Do not stop your research here; broaden your watchlist with focused sets of companies that match the kind of opportunities you are actually looking for next.
- Target potential mispricings by scanning these 877 undervalued stocks based on cash flows that may offer a more attractive entry price than the broader market.
- Explore emerging technology themes by checking out these 25 AI penny stocks that are directly tied to artificial intelligence developments.
- Adjust your income focus by reviewing these 11 dividend stocks with yields > 3% that may help you evaluate yield-focused opportunities.
This article by Simply Wall St is general in nature. We provide commentary based on historical data and analyst forecasts only using an unbiased methodology and our articles are not intended to be financial advice. It does not constitute a recommendation to buy or sell any stock, and does not take account of your objectives, or your financial situation. We aim to bring you long-term focused analysis driven by fundamental data. Note that our analysis may not factor in the latest price-sensitive company announcements or qualitative material. Simply Wall St has no position in any stocks mentioned.
Have feedback on this article? Concerned about the content? Get in touch with us directly. Alternatively, email editorial-team@simplywallst.com