
 Nasdaq
 華爾街日報
華爾街日報Is Target (TGT) Offering Value After Recent Share Price Rebound?
- If you are wondering whether Target's share price reflects what the business is worth, or if the market is mispricing it right now, this article walks through the key clues in plain English.
- Over the last week the stock returned 7.1%, with a 13.1% return over 30 days and 3.8% year to date, even though the 1 year and 5 year returns sit at a 21.8% decline and a 39.8% decline.
- Recent attention on Target has focused on how its long term share price record, including a 25.8% decline over 3 years, compares with its large retail peers and the broader US consumer retail sector. That context has put more focus on whether the current price around US$104.30 fairly reflects expectations that may already be baked into the stock.
- Simply Wall St currently gives Target a valuation score of 5 out of 6, which means it screens as undervalued on most of the checks used in that framework. Next we will walk through the key valuation methods, then finish with a more holistic way to think about value beyond the headline numbers.
Find out why Target's -21.8% return over the last year is lagging behind its peers.
Approach 1: Target Discounted Cash Flow (DCF) Analysis
A Discounted Cash Flow model projects the cash a company might generate in the future and then discounts those cash flows back to today, to estimate what the entire business could be worth right now.
For Target, the model uses a 2 stage Free Cash Flow to Equity approach, starting from last twelve months free cash flow of about $2.9b. Analyst estimates underpin projections through 2030, with Simply Wall St extrapolating beyond the explicit analyst horizon. By 2035, the model is working with projected annual free cash flows in the region of $3.9b, all expressed in US$ and discounted back to today.
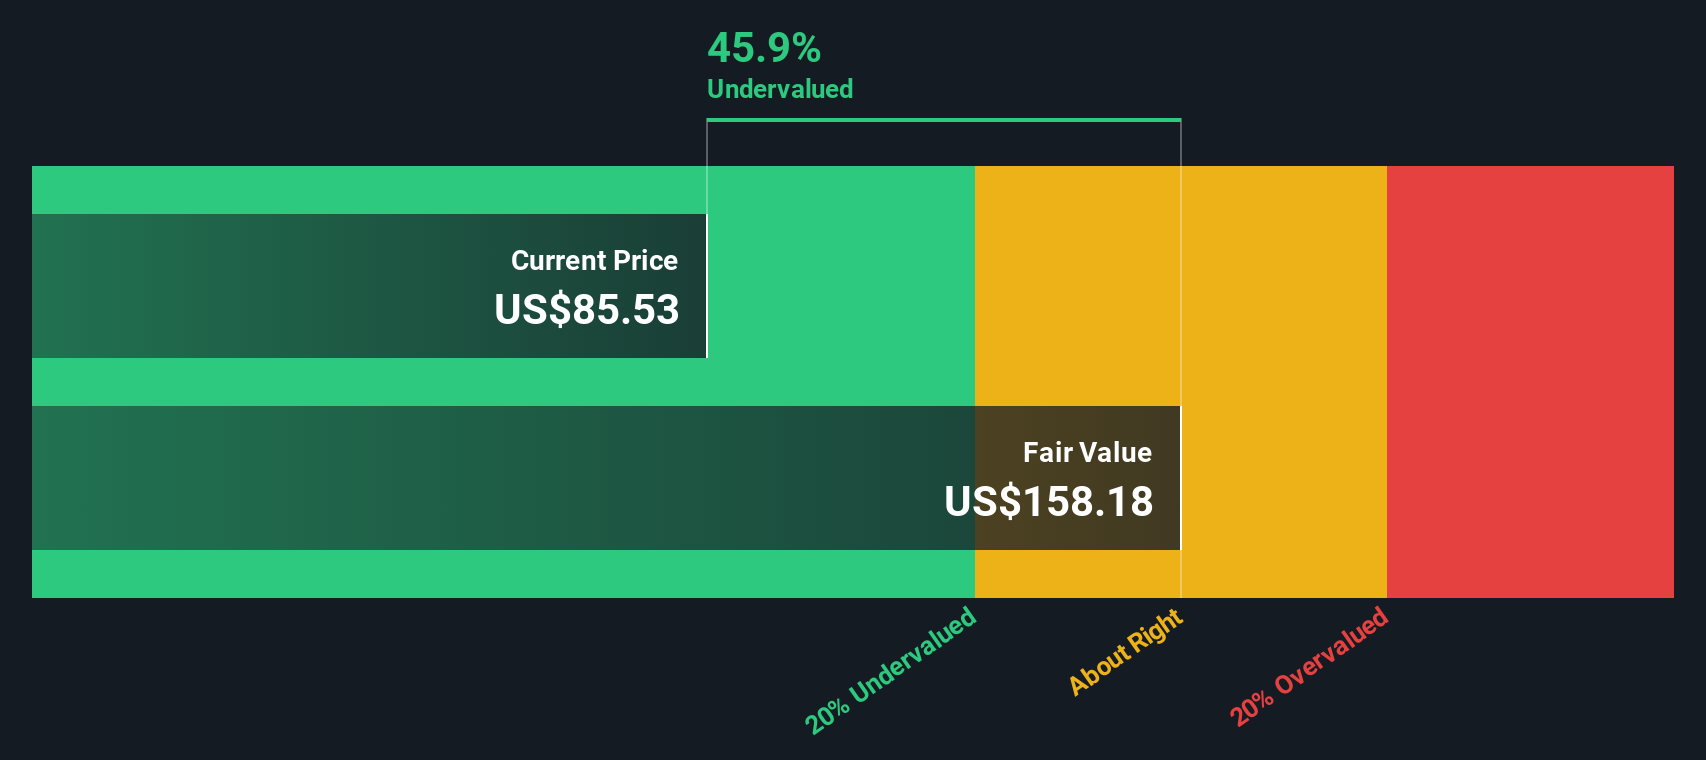
On this basis, the DCF output suggests an intrinsic value of about $138.81 per share, compared with a current share price around $104.30. That implies an intrinsic discount of roughly 24.9%, which means the model indicates Target trades below the value implied by its projected cash flows.
Result: UNDERVALUED
Our Discounted Cash Flow (DCF) analysis suggests Target is undervalued by 24.9%. Track this in your watchlist or portfolio, or discover 877 more undervalued stocks based on cash flows.
Approach 2: Target Price vs Earnings (P/E)
For a profitable company like Target, the P/E ratio is a straightforward way to gauge what investors are currently paying for each dollar of earnings. Higher growth expectations or lower perceived risk can support a higher, or “richer,” P/E, while slower growth or higher risk usually line up with a lower P/E as a more reasonable norm.
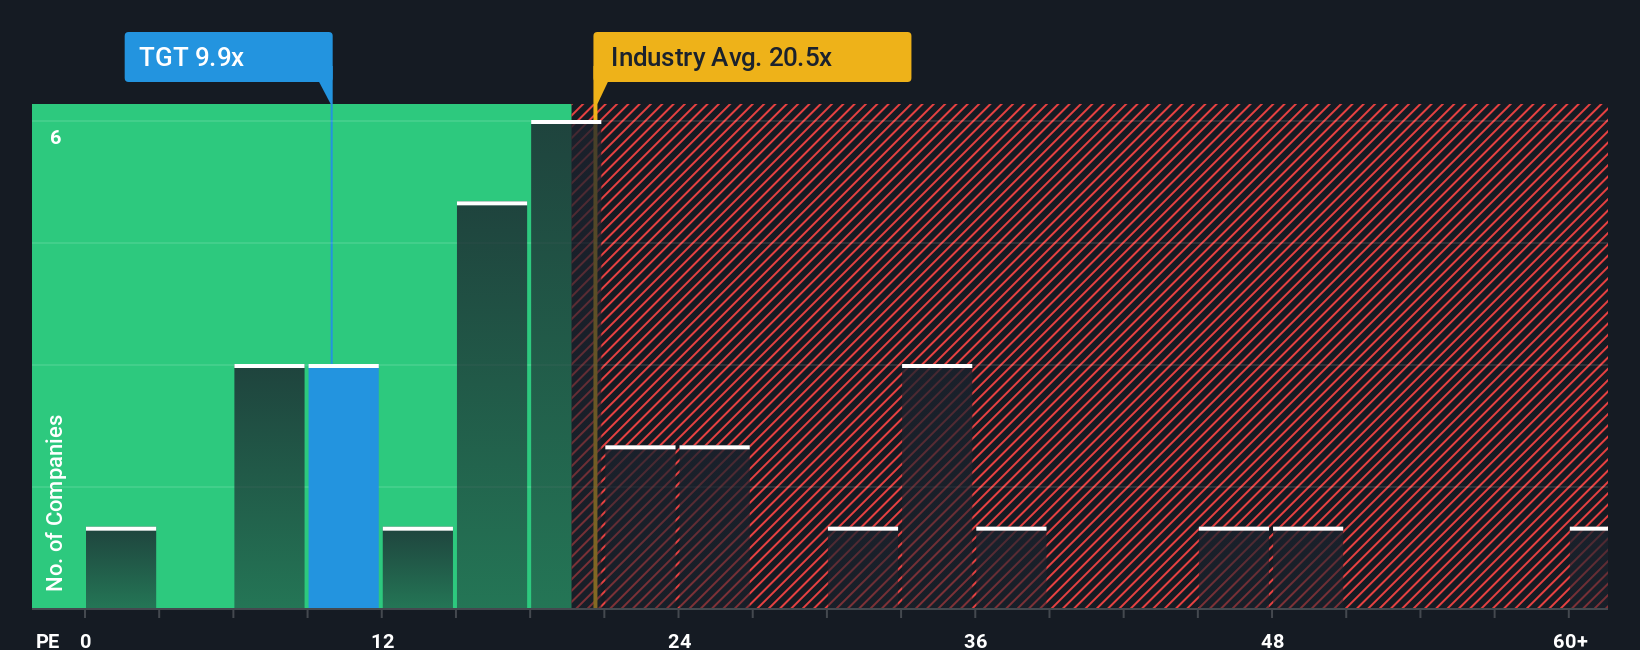
Target currently trades on a P/E of about 12.6x. That sits below the Consumer Retailing industry average of around 22.9x and below the broader peer group average of about 29.3x. On the surface, that gap suggests the market is assigning a lower earnings multiple to Target compared with many large retail peers.
Simply Wall St’s “Fair Ratio” is its proprietary estimate of what a balanced P/E should be for Target, at about 20.5x. This figure blends factors like earnings growth, profit margins, size, industry and specific risks, so it aims to be more tailored than a simple comparison with sector or peer averages. Because 20.5x is materially higher than Target’s current 12.6x, this framework points to the shares screening as undervalued on an earnings multiple basis.
Result: UNDERVALUED
P/E ratios tell one story, but what if the real opportunity lies elsewhere? Discover 1449 companies where insiders are betting big on explosive growth.
Upgrade Your Decision Making: Choose your Target Narrative
Earlier we mentioned that there is an even better way to understand valuation. Narratives let you attach a simple story about Target to the numbers you care about, such as your view on its future revenue, earnings, margins and fair value. You can then link that story to a financial forecast and a fair value estimate that you can compare with the current share price to help you decide whether the stock looks attractive or not.
On Simply Wall St’s Community page, millions of investors use Narratives as an accessible tool where each person can set assumptions, see an output fair value next to the live market price, and watch that view refresh when new earnings, news or analyst estimates arrive.
For example, one investor might plug in assumptions that are closer to the higher analyst earnings and price target case for Target, while another might lean toward the lower earnings and US$82 price target case. Narratives makes both views visible so you can see how different expectations on revenue growth, margins and valuation multiples add up to very different fair values for the same company.
Do you think there's more to the story for Target? Head over to our Community to see what others are saying!

This article by Simply Wall St is general in nature. We provide commentary based on historical data and analyst forecasts only using an unbiased methodology and our articles are not intended to be financial advice. It does not constitute a recommendation to buy or sell any stock, and does not take account of your objectives, or your financial situation. We aim to bring you long-term focused analysis driven by fundamental data. Note that our analysis may not factor in the latest price-sensitive company announcements or qualitative material. Simply Wall St has no position in any stocks mentioned.
Have feedback on this article? Concerned about the content? Get in touch with us directly. Alternatively, email editorial-team@simplywallst.com