
 Nasdaq
 華爾街日報
華爾街日報Assessing Fincantieri (BIT:FCT) Valuation After Strong Long Term Returns And Recent Share Price Volatility
Fincantieri (BIT:FCT) has drawn fresh attention after recent share price swings, with the stock showing mixed short term returns and a very large 1 year total return. This combination may prompt closer scrutiny from investors.
See our latest analysis for Fincantieri.
Recent trading has been choppy, with a 7 day share price return of 9.88% and a 90 day share price return decline of 31.32%. However, the 1 year total shareholder return of 148.51% and 3 year total shareholder return of just over 3x suggest momentum has been powerful over a longer stretch.
If Fincantieri’s moves have you looking more broadly at industrial and infrastructure names, it could be a good time to widen your search with aerospace and defense stocks.
With the shares up strongly over 1 and 3 years and the current price sitting below the average analyst target, the key question now is simple: is Fincantieri still undervalued, or is the market already pricing in future growth?
Most Popular Narrative Narrative: 18.5% Undervalued
The most followed narrative pegs Fincantieri’s fair value at about €22.51 per share, compared with the last close of €18.35, framing a meaningful upside gap.
Structural focus on green and digital shipbuilding, including investments in decarbonization technologies and digitalization through ventures like Fincantieri Ingenium, places the company at the forefront of regulatory-driven fleet renewals and value-added retrofits, potentially elevating long-term EBITDA margins.
Want to see what is built into that valuation gap? Revenue expansion, fatter margins and a future earnings multiple all pull in the same direction. Curious which assumptions really carry the model?
Result: Fair Value of $22.51 (UNDERVALUED)
Have a read of the narrative in full and understand what's behind the forecasts.
However, the story could change quickly if Fincantieri encounters execution problems on complex, long-cycle naval and cruise projects, or if cruise and defense demand weakens and dents that concentrated revenue base.
Find out about the key risks to this Fincantieri narrative.
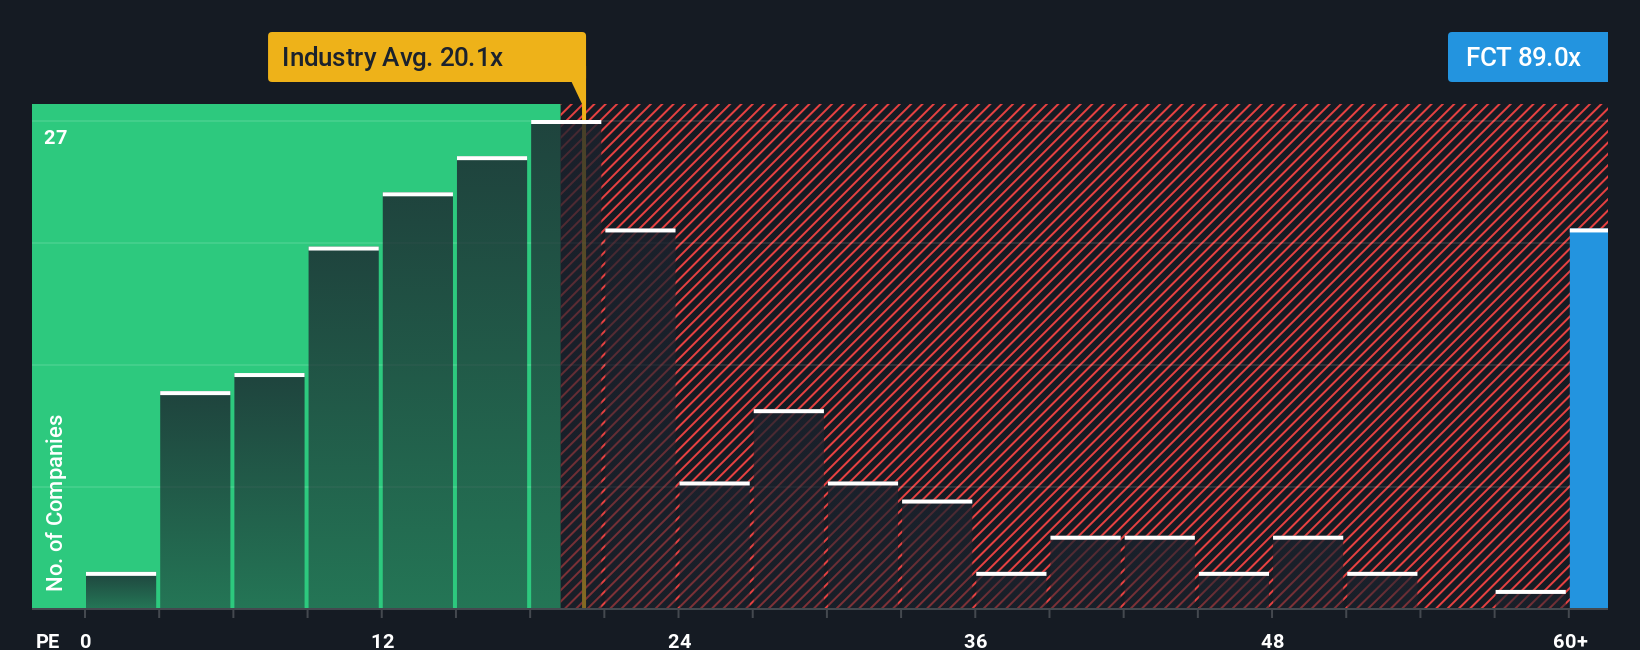
Another Angle: Rich Earnings Multiple Raises Questions
The narrative fair value of €22.51 suggests upside, but the current P/E of 62.2x tells a very different story. It is far above the European Machinery average of 21.6x, the peer average of 17.3x, and even the fair ratio of 33.7x that the market could move towards.
That gap means a large part of today’s price already depends on strong future earnings delivery, leaving less room for error if growth or margins come in below expectations. With the stock also trading above the Simply Wall St DCF estimate of €5.02 per share, which view do you think appears more realistic?
See what the numbers say about this price — find out in our valuation breakdown.
Build Your Own Fincantieri Narrative
If you are not fully on board with this view, or just want to test your own assumptions against the numbers, you can build a custom thesis in a few minutes with Do it your way.
A great starting point for your Fincantieri research is our analysis highlighting 3 key rewards and 2 important warning signs that could impact your investment decision.
Looking for more investment ideas?
If Fincantieri has sharpened your focus, do not stop here. Use the screener to surface other potential opportunities before they move beyond your comfort zone.
- Target potential mispricings by scanning these 877 undervalued stocks based on cash flows that might offer more appealing entry points based on their cash flow profiles.
- Capture growth themes early by checking out these 25 AI penny stocks that are linked to artificial intelligence trends and related earnings stories.
- Strengthen your income watchlist by reviewing these 11 dividend stocks with yields > 3% that currently offer yields above 3% and may suit a cash flow focused approach.
This article by Simply Wall St is general in nature. We provide commentary based on historical data and analyst forecasts only using an unbiased methodology and our articles are not intended to be financial advice. It does not constitute a recommendation to buy or sell any stock, and does not take account of your objectives, or your financial situation. We aim to bring you long-term focused analysis driven by fundamental data. Note that our analysis may not factor in the latest price-sensitive company announcements or qualitative material. Simply Wall St has no position in any stocks mentioned.
Have feedback on this article? Concerned about the content? Get in touch with us directly. Alternatively, email editorial-team@simplywallst.com