
 Nasdaq
 華爾街日報
華爾街日報Is Virtu Financial (VIRT) Attractively Priced After Mixed Share Price Returns?
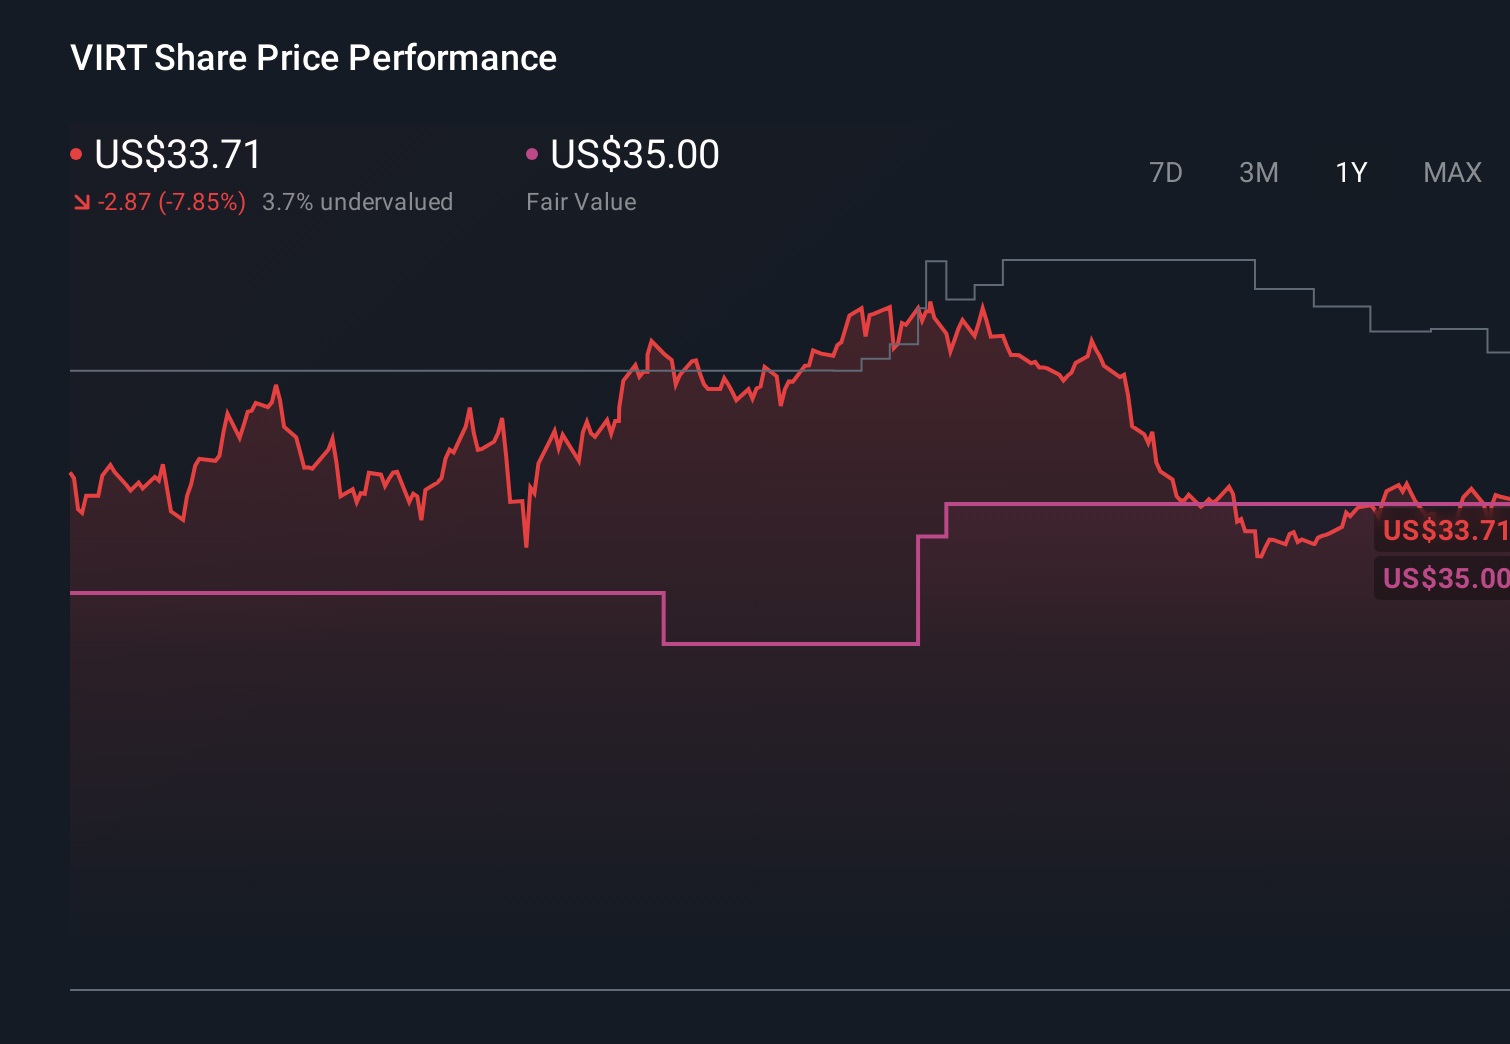
- If you are wondering whether Virtu Financial's current share price still reflects good value, it helps to step back and look at what the recent returns and our valuation checks are really saying.
- The stock last closed at US$33.17, with a 7 day return of a 2.4% decline, a 30 day return of a 6.2% decline, a 1 year return of a 6.0% decline, and a 72.3% return over 3 years and a 65.2% return over 5 years.
- These mixed returns sit against an ongoing flow of market commentary about liquidity providers and trading firms, including Virtu Financial, that focuses on how trading volumes, volatility patterns, and regulatory discussions can influence investor sentiment. While the headlines change, they give important context for why short term moves can look very different to the longer term track record.
- Right now, Virtu Financial scores 6 out of 6 on our valuation checks, which you can see in full in our valuation scorecard. Next we will look at the main valuation approaches investors tend to rely on, before finishing with a way to interpret valuation that many readers find even more useful.
Find out why Virtu Financial's -6.0% return over the last year is lagging behind its peers.
Approach 1: Virtu Financial Excess Returns Analysis
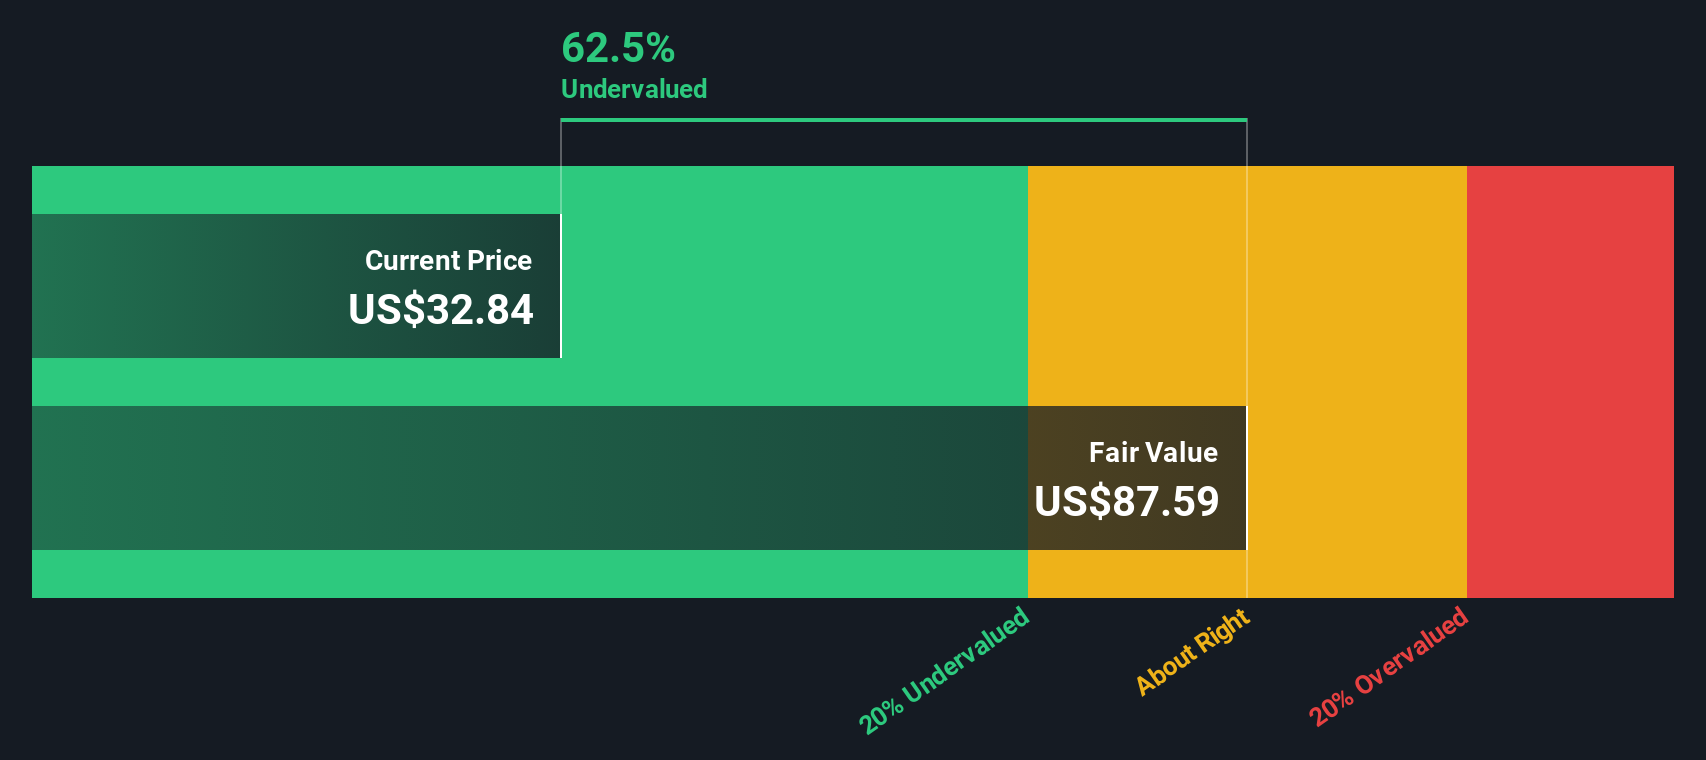
The Excess Returns model looks at how much profit a company generates above the return that equity investors typically require, then capitalizes those extra profits into an intrinsic value per share.
For Virtu Financial, the starting point is its book value of $17.14 per share, which represents the equity base the business is working with. On that base, the model uses a stable earnings figure of $5.00 per share, sourced from the median return on equity over the past 5 years, and a cost of equity of $2.35 per share.
The difference between those two, $2.65 per share, is the estimated excess return that Virtu Financial is generating above its equity cost. The model also uses a stable book value estimate of $20.52 per share, based on weighted future book value estimates from 3 analysts, and an average return on equity of 24.38% to project how these excess returns could persist.
When these excess returns are capitalized, the model arrives at an intrinsic value of about $52.77 per share. Compared with the recent share price of $33.17, that implies the stock is 37.1% undervalued.
Result: UNDERVALUED
Our Excess Returns analysis suggests Virtu Financial is undervalued by 37.1%. Track this in your watchlist or portfolio, or discover 876 more undervalued stocks based on cash flows.
Approach 2: Virtu Financial Price vs Earnings
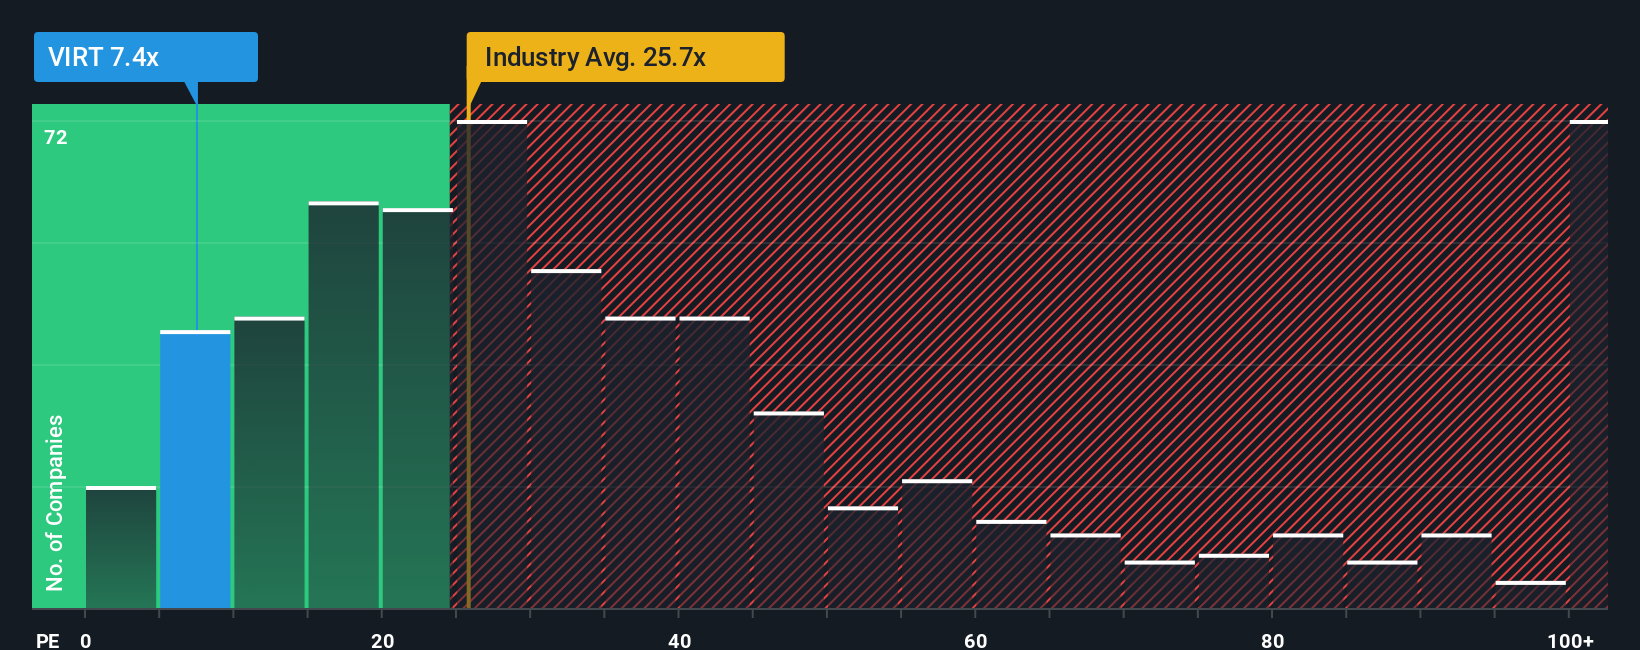
For a profitable company like Virtu Financial, the P/E ratio is a useful way to relate what you pay per share to the earnings the business is currently generating. It gives you a quick sense of how many dollars of price you are paying for each dollar of earnings.
What counts as a "normal" P/E depends on how investors view growth potential and risk. Higher expected growth or lower perceived risk often supports a higher P/E, while more uncertainty or weaker growth prospects usually points to a lower one.
Virtu Financial currently trades on a P/E of 7.12x. That sits below the Capital Markets industry average of 25.75x and also below the peer group average of 13.03x. Simply Wall St’s Fair Ratio for Virtu Financial is 13.52x, which is an estimate of what a reasonable P/E could look like after factoring in the company’s earnings profile, industry, profit margins, market cap and specific risks.
This Fair Ratio can be more informative than a simple peer or industry comparison because it adjusts for those company level characteristics instead of assuming that all firms should trade on similar multiples. With the Fair Ratio above the current 7.12x P/E, this framework points to the shares looking undervalued on an earnings basis.
Result: UNDERVALUED
P/E ratios tell one story, but what if the real opportunity lies elsewhere? Discover 1448 companies where insiders are betting big on explosive growth.
Upgrade Your Decision Making: Choose your Virtu Financial Narrative
Earlier we mentioned that there is an even better way to understand valuation, so let us introduce you to Narratives. Here, you build a clear story about Virtu Financial by linking your view of its future revenue, earnings and margins to a financial forecast, a fair value, and then a simple comparison with the current share price. All of this happens within Simply Wall St’s Community page, which updates as new news or earnings arrive. One investor might create a Narrative that leans toward the higher analyst price target of US$52.00 based on confidence in market expansion and leadership changes, while another might anchor closer to the lower US$35.00 target because they are more focused on risks around competition or digital assets. Both can quickly see how their chosen fair value stacks up against today’s price and what that means for their own decision on whether the shares look attractive or not.
Do you think there's more to the story for Virtu Financial? Head over to our Community to see what others are saying!
This article by Simply Wall St is general in nature. We provide commentary based on historical data and analyst forecasts only using an unbiased methodology and our articles are not intended to be financial advice. It does not constitute a recommendation to buy or sell any stock, and does not take account of your objectives, or your financial situation. We aim to bring you long-term focused analysis driven by fundamental data. Note that our analysis may not factor in the latest price-sensitive company announcements or qualitative material. Simply Wall St has no position in any stocks mentioned.
Have feedback on this article? Concerned about the content? Get in touch with us directly. Alternatively, email editorial-team@simplywallst.com