
 Nasdaq
 華爾街日報
華爾街日報Is It Time To Reassess AMD (AMD) After Its Strong Multi Year Share Price Run
- If you are wondering whether Advanced Micro Devices (AMD) is priced attractively right now, you are not alone. Many investors are trying to work out what a fair value looks like after a strong multi year run.
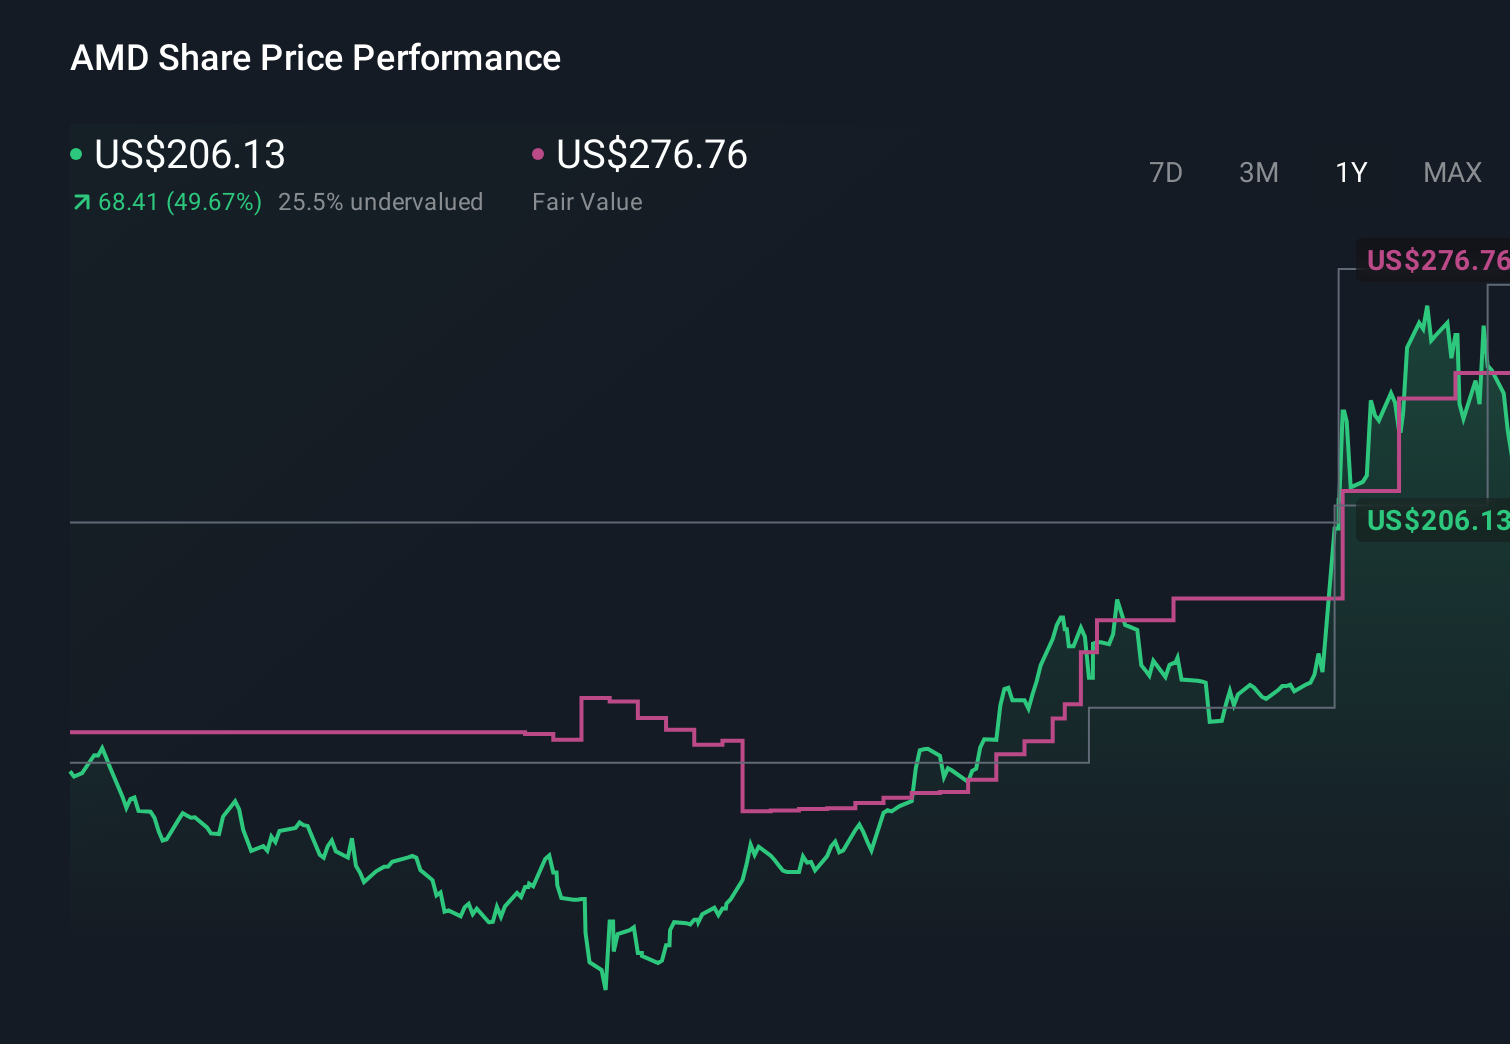
- AMD's share price recently closed at US$214.26, with returns of a 0.5% decline over 7 days, a 1.7% decline over 30 days, a 4.1% decline year to date, a 68.3% gain over 1 year, and a 214.9% gain over 3 years, while the 5 year return sits at 124.7%.
- Recent headlines have focused on AMD's role in high performance computing and artificial intelligence chips, as investors watch how its product roadmap competes with other large semiconductor players. These developments help frame how the market is thinking about AMD's future opportunities and the risks that could come with a fast changing chip sector.
- On our checks, AMD scores a 3/6 valuation score. This suggests that some measures point to the shares looking inexpensive while others do not. Next we will look at what different valuation methods say about that price tag and then finish with a simple way to keep all of these signals in context.
Approach 1: Advanced Micro Devices Discounted Cash Flow (DCF) Analysis
A Discounted Cash Flow, or DCF, model estimates what a company could be worth by projecting its future cash flows and then discounting those back to today’s value. It is essentially asking what the stream of future cash AMD might generate is worth in today’s dollars.
For Advanced Micro Devices, the model uses a 2 Stage Free Cash Flow to Equity approach, starting from last twelve month free cash flow of about $5.57b. Analyst forecasts and subsequent extrapolations see free cash flow reaching $36.94b in 2030, with a detailed set of projections each year between 2026 and 2035 that are discounted back using Simply Wall St’s assumptions.
When those projected cash flows are added up and adjusted, the DCF model arrives at an estimated intrinsic value of about $324.80 per share. Compared with the recent share price of $214.26, this DCF output suggests the shares are 34.0% undervalued based on these cash flow assumptions.
Result: UNDERVALUED
Our Discounted Cash Flow (DCF) analysis suggests Advanced Micro Devices is undervalued by 34.0%. Track this in your watchlist or portfolio, or discover 882 more undervalued stocks based on cash flows.
Approach 2: Advanced Micro Devices Price vs Earnings
For a profitable company like Advanced Micro Devices, the P/E ratio is a useful way to see what investors are currently willing to pay for each dollar of earnings. Higher growth expectations and lower perceived risk usually justify a higher P/E, while slower expected growth or higher uncertainty tend to align with a lower, more conservative P/E.
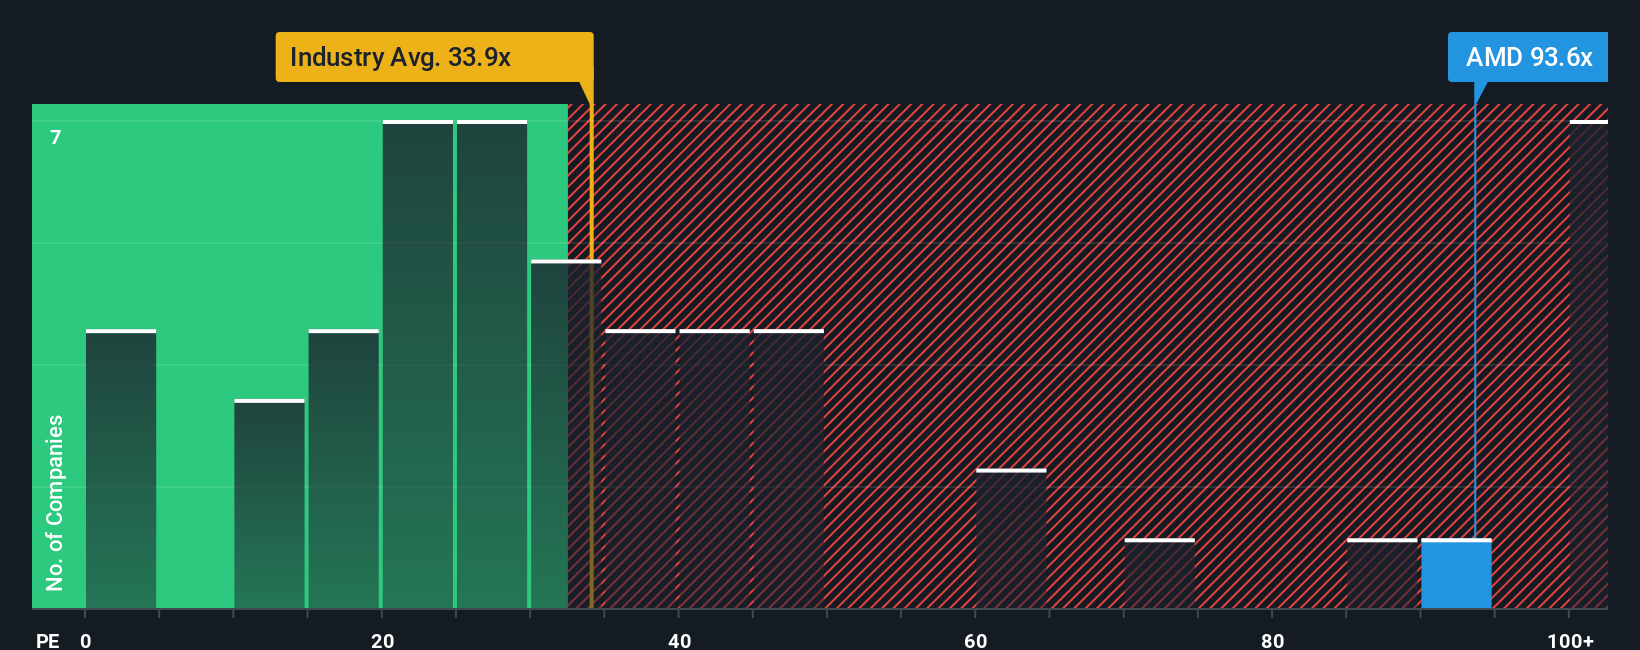
AMD is currently trading on a P/E of 111.41x. That sits above both the Semiconductor industry average P/E of 38.66x and a peer group average of 62.49x, so the shares are priced at a higher multiple of earnings than many sector peers.
Simply Wall St’s Fair Ratio for AMD is 64.52x. This is a proprietary estimate of what AMD’s P/E might look like when you factor in elements such as earnings growth, industry, profit margins, market cap and company specific risks. Because it blends these drivers, the Fair Ratio can be a more tailored benchmark than a simple comparison with peers or the wider industry.
With AMD’s current P/E of 111.41x above the Fair Ratio of 64.52x, this approach points to the shares looking expensive on earnings multiples.
Result: OVERVALUED
P/E ratios tell one story, but what if the real opportunity lies elsewhere? Discover 1450 companies where insiders are betting big on explosive growth.
Upgrade Your Decision Making: Choose your Advanced Micro Devices Narrative
Earlier we mentioned that there is an even better way to understand valuation. Let us introduce you to Narratives, which are simply your own story about AMD that links what you believe about its future revenue, earnings and margins to a financial forecast and a Fair Value. The tool then compares that Fair Value to today’s price inside an easy interface on Simply Wall St’s Community page. It updates automatically when fresh news or earnings are released. You can see, for example, one AMD Narrative that treats the stock as worth about US$136.68 based on more cautious assumptions, and another that sees Fair Value closer to about US$362.15 based on much stronger AI and data center expectations. You can then decide for yourself which story feels closer to how you see the company.
For Advanced Micro Devices, however, we will make it really easy for you with previews of two leading Advanced Micro Devices Narratives:
Each one connects a different set of assumptions to a Fair Value, so you can quickly see which story feels closer to how you view AMD.
🐂 Advanced Micro Devices Bull Case
Fair value: about US$283.57 per share
Valuation gap: roughly 24.5% below this fair value based on the last close of US$214.26
Revenue growth assumption: 34.7% a year
- Analysts tie their outlook to multiyear AI and data center deals, with a focus on MI300 and follow on accelerators, EPYC CPUs, and Xilinx based adaptive computing.
- The narrative leans on improving margins over time, supported by higher AI related revenue, operating leverage and a richer product mix.
- Key risks flagged include heavy ongoing investment, execution on very large AI commitments, intense competition in GPUs and custom silicon, and evolving export controls.
🐻 Advanced Micro Devices Bear Case
Fair value: about US$193.68 per share
Valuation gap: roughly 10.6% above this fair value based on the last close of US$214.26
Revenue growth assumption: 18.8% a year
- This view places more weight on cyclicality, competitive pressure from Nvidia, Intel and ARM based designs, and execution risks in AI GPUs and data center products.
- It also highlights reliance on TSMC, geopolitical and supply chain uncertainty, and slower or more uneven growth in PCs and gaming as potential constraints.
- The narrative still factors in solid growth drivers in AI, data centers and adaptive computing, but questions whether current pricing fully reflects the mix of growth potential and these risks.
Together, these narratives bracket a fair value range that sits either side of AMD’s recent share price and they spell out exactly which assumptions need to be true in each case. The useful next step is to decide which set of expectations feels more realistic to you, adjust the numbers where needed, and see how that shifts the Fair Value and your conviction level.
Curious how numbers become stories that shape markets? Explore Community Narratives
Do you think there's more to the story for Advanced Micro Devices? Head over to our Community to see what others are saying!
This article by Simply Wall St is general in nature. We provide commentary based on historical data and analyst forecasts only using an unbiased methodology and our articles are not intended to be financial advice. It does not constitute a recommendation to buy or sell any stock, and does not take account of your objectives, or your financial situation. We aim to bring you long-term focused analysis driven by fundamental data. Note that our analysis may not factor in the latest price-sensitive company announcements or qualitative material. Simply Wall St has no position in any stocks mentioned.
Have feedback on this article? Concerned about the content? Get in touch with us directly. Alternatively, email editorial-team@simplywallst.com