
 Nasdaq
 華爾街日報
華爾街日報Is PENN Entertainment (PENN) A Potential Opportunity After Years Of Share Price Weakness
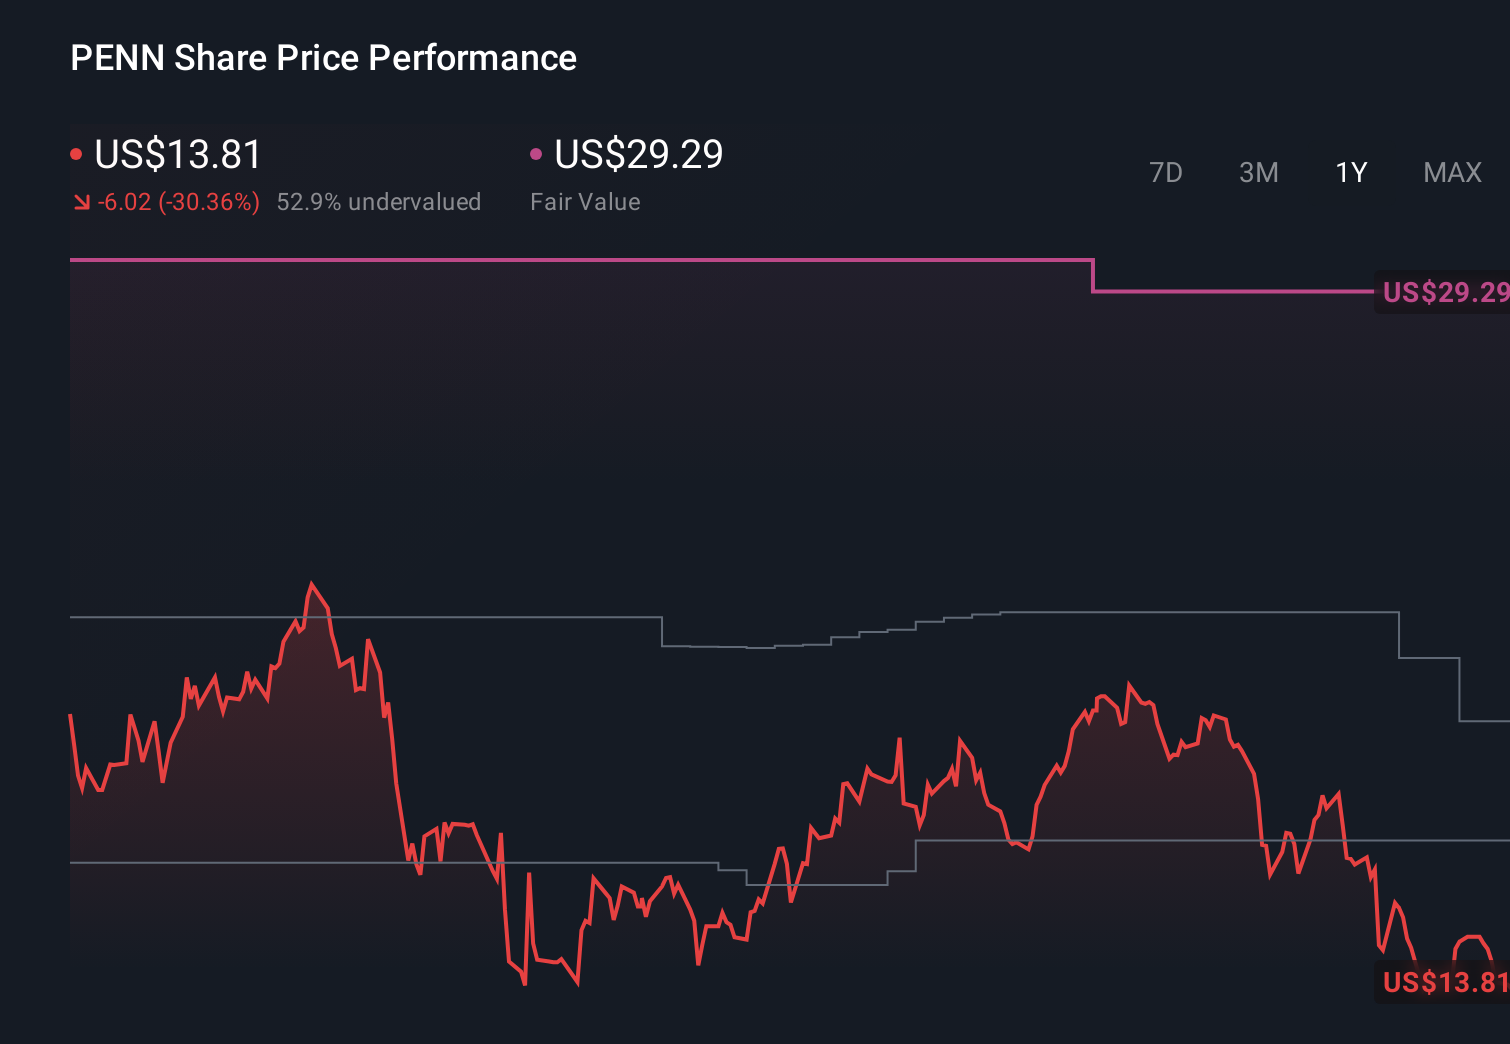
- If you are wondering whether PENN Entertainment is a bargain or a value trap at around US$14.81, you are not alone. The numbers offer some clear signals to examine.
- The share price return is 0.2% over the last 7 days and 7.2% over the last 30 days, while year to date the return is a 0.3% decline. Over 1 year the return is a 22.1% decline, and over 3 and 5 years the returns are 52.7% decline and 86.0% decline respectively.
- Recent market attention on PENN Entertainment has been shaped by ongoing discussion around its position in the US gaming and entertainment sector and how the market is currently pricing that exposure. This context helps explain why short term moves can look very different to the longer term share price record.
- PENN Entertainment currently scores 5 out of 6 on our valuation checks, which suggests it screens as undervalued on most of the metrics we use. Next we will look at how different valuation approaches arrive at that view, then finish with a way to assess whether those numbers really fit the long term story.
Find out why PENN Entertainment's -22.1% return over the last year is lagging behind its peers.
Approach 1: PENN Entertainment Discounted Cash Flow (DCF) Analysis
A Discounted Cash Flow, or DCF, model takes estimates of the cash PENN Entertainment could generate in the future and discounts those back to what they might be worth in today's dollars.
For PENN, the model used is a 2 Stage Free Cash Flow to Equity approach. The latest twelve month free cash flow is a loss of $11.94 million, so the story here is about what the cash flows could look like if they move into positive territory rather than what they are today.
Analysts have provided forecasts out to 2027, with free cash flow projected at $383 million by the end of that year. Beyond that, Simply Wall St extrapolates estimates through to 2035, with projected annual free cash flows in the hundreds of millions of dollars each year, all expressed in US$ and then discounted back to today.
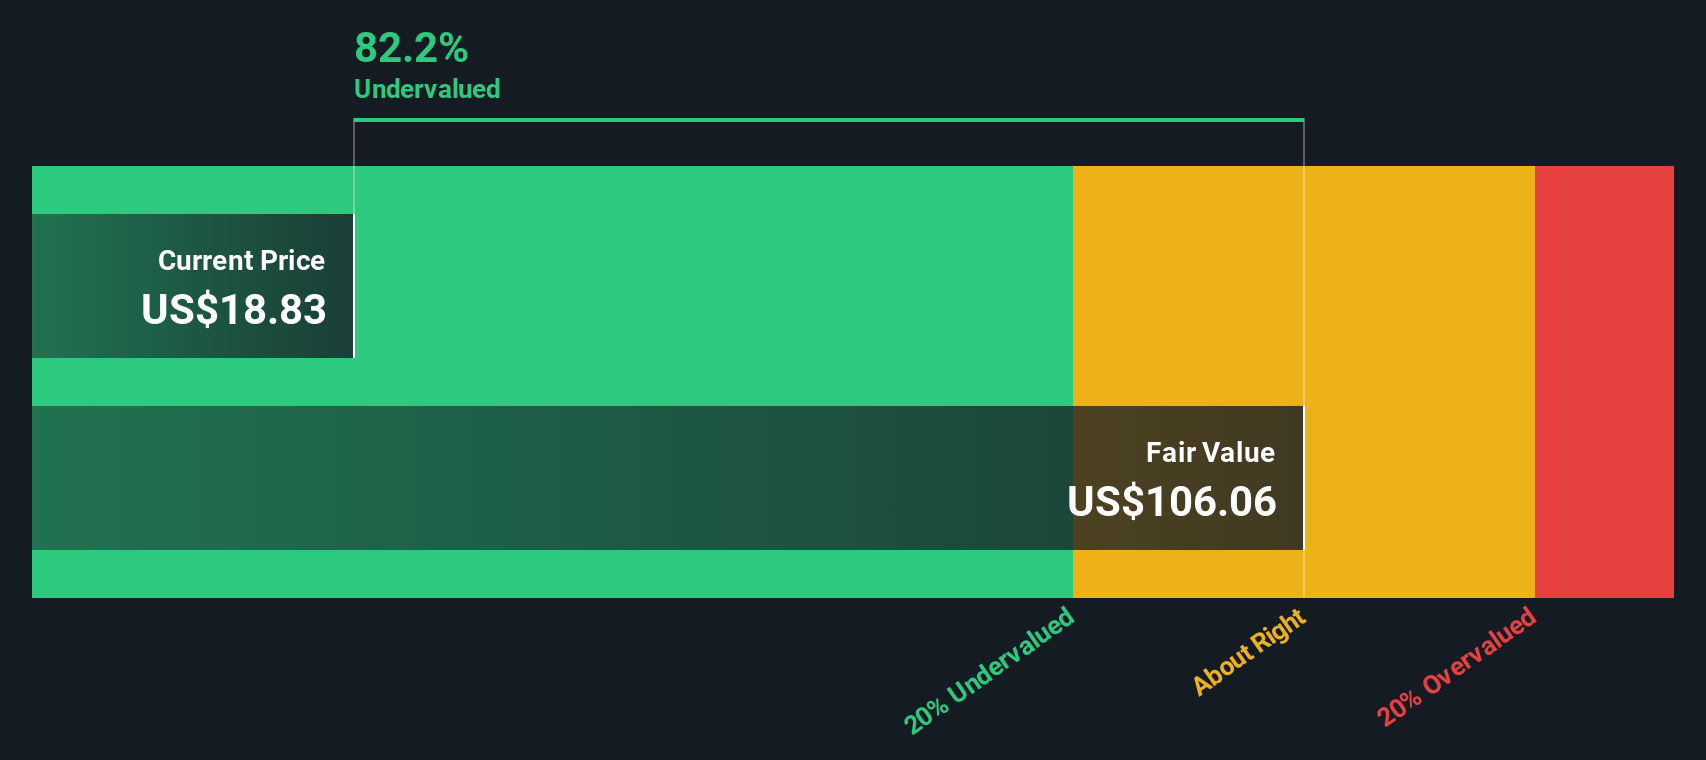
Putting those projections together, the DCF model arrives at an estimated intrinsic value of about $58.62 per share. Compared with a recent share price around $14.81, the model indicates that PENN Entertainment appears significantly undervalued, with an implied discount of 74.7%.
Result: UNDERVALUED
Our Discounted Cash Flow (DCF) analysis suggests PENN Entertainment is undervalued by 74.7%. Track this in your watchlist or portfolio, or discover 882 more undervalued stocks based on cash flows.
Approach 2: PENN Entertainment Price vs Sales
For companies where earnings are limited or volatile, the P/S ratio is often more useful than P/E because it compares the value of the business to its revenue rather than to accounting profit. It lets you ask what investors are currently paying for each dollar of sales, regardless of where margins sit.
What counts as a “normal” or “fair” multiple is shaped by how quickly sales are expected to grow and how risky those sales are. Higher growth and lower perceived risk can support a higher P/S, while slower growth or higher risk usually point to a lower multiple.
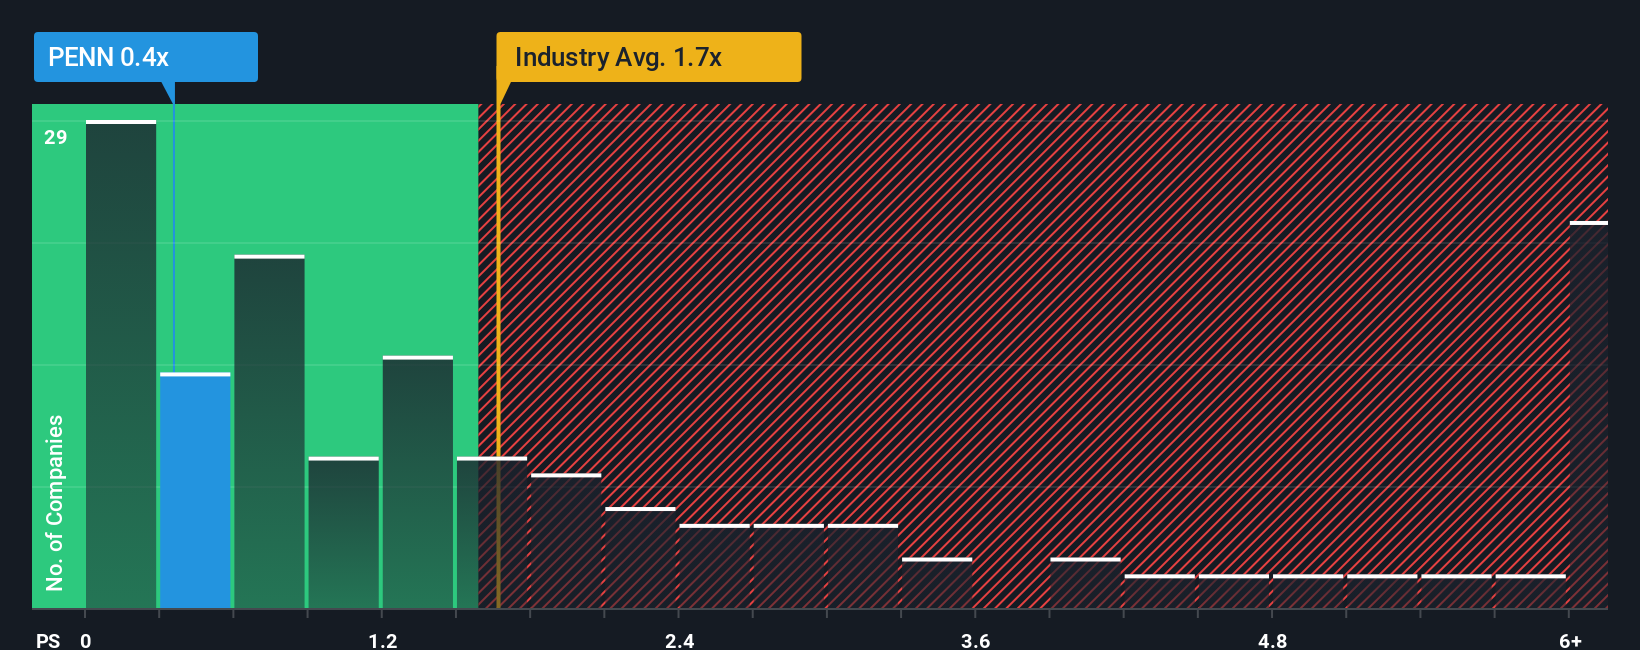
PENN Entertainment currently trades on a P/S of 0.29x. That sits well below the Hospitality industry average P/S of 1.68x and also below the peer average of 2.24x. Simply Wall St’s Fair Ratio for PENN is 1.03x. This is a proprietary estimate of what the P/S might be given factors such as PENN’s earnings profile, industry, profit margins, market value and key risks.
Because the Fair Ratio adjusts for those company specific features, it is a more tailored benchmark than a simple industry or peer comparison. With the actual P/S at 0.29x versus a Fair Ratio of 1.03x, the shares currently appear undervalued on this metric.
Result: UNDERVALUED
P/S ratios tell one story, but what if the real opportunity lies elsewhere? Discover 1450 companies where insiders are betting big on explosive growth.
Upgrade Your Decision Making: Choose your PENN Entertainment Narrative
Earlier we mentioned that there is an even better way to understand valuation. On Simply Wall St's Community page you can use Narratives to put your own story about PENN Entertainment into a simple forecast that links your assumptions for revenue, earnings and margins to a fair value. It then compares that to the current price to help you decide whether the stock looks attractive or expensive to you, and automatically updates your view as new news or earnings arrive. For example, a bullish investor who thinks PENN can reach around US$471.4 million in earnings by about 2028 and sees the higher analyst fair values near US$30 can hold a very different Narrative from a cautious investor who focuses on the lower fair value of about US$19.11 and the more conservative analyst price target near US$17.
Do you think there's more to the story for PENN Entertainment? Head over to our Community to see what others are saying!
This article by Simply Wall St is general in nature. We provide commentary based on historical data and analyst forecasts only using an unbiased methodology and our articles are not intended to be financial advice. It does not constitute a recommendation to buy or sell any stock, and does not take account of your objectives, or your financial situation. We aim to bring you long-term focused analysis driven by fundamental data. Note that our analysis may not factor in the latest price-sensitive company announcements or qualitative material. Simply Wall St has no position in any stocks mentioned.
Have feedback on this article? Concerned about the content? Get in touch with us directly. Alternatively, email editorial-team@simplywallst.com