
 Nasdaq
 華爾街日報
華爾街日報Is Brookfield Asset Management (TSX:BAM) Pricing In Too Much Optimism After Strong Three Year Run?
- If you are wondering whether Brookfield Asset Management is reasonably priced at its current level, you are not alone and this article is built to help you make sense of that question.
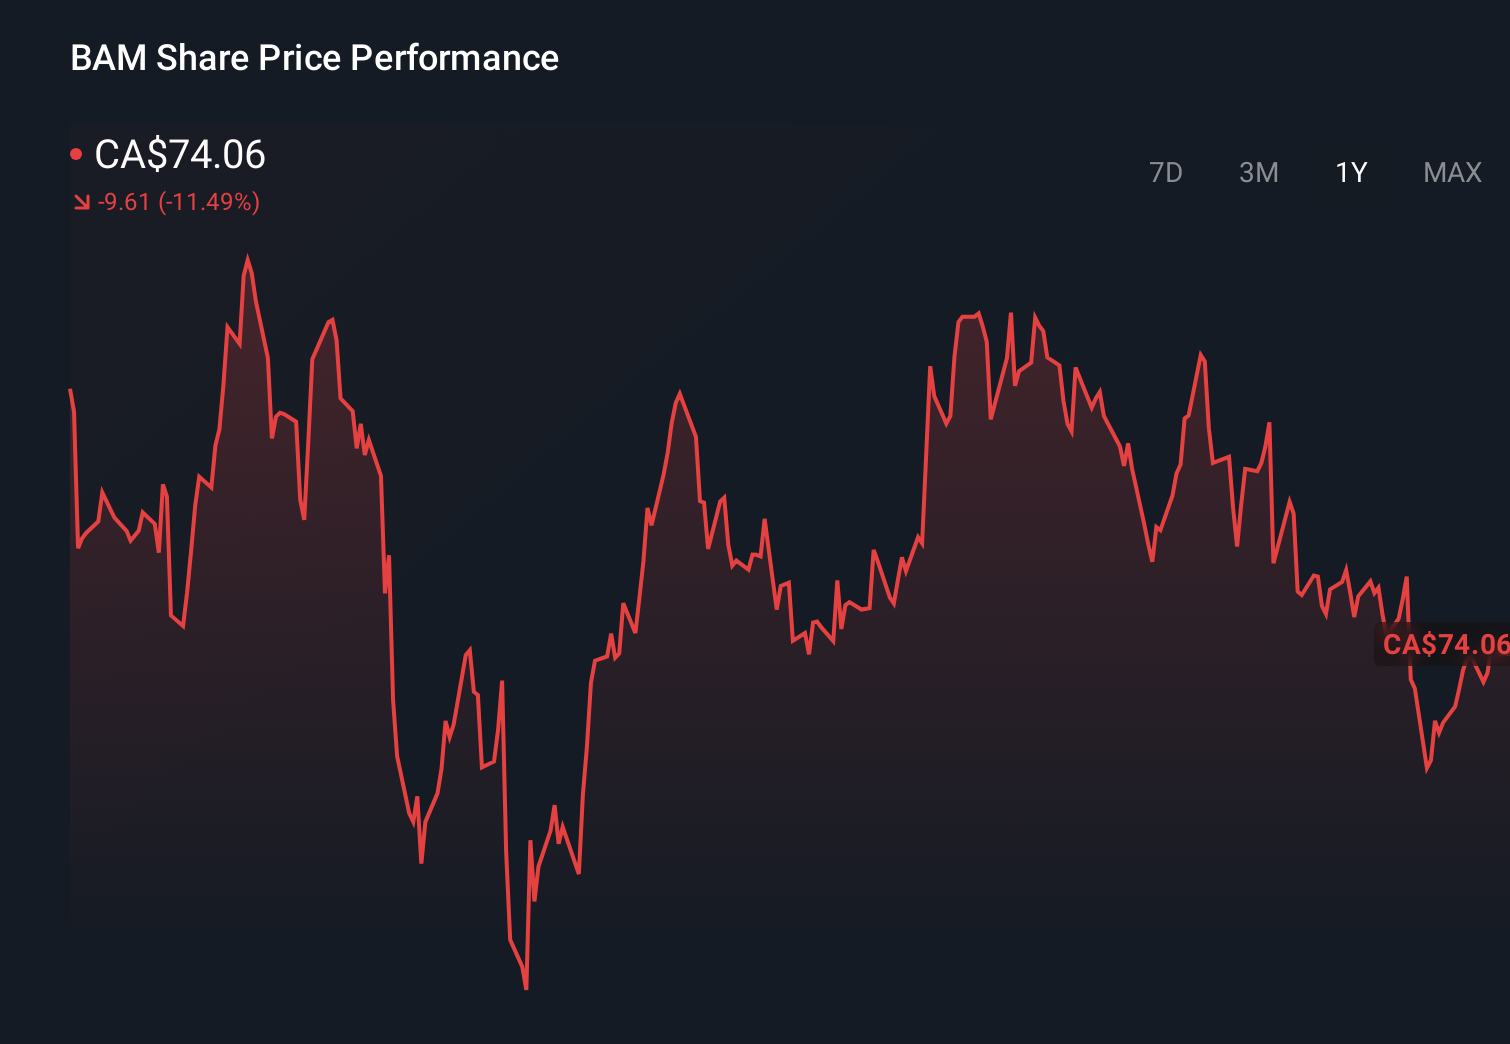
- The share price recently closed at C$75.37, with returns of 4.5% over the last 7 days, 2.3% over the last 30 days, 2.7% year to date, and 0.3% over the last year, while the 3 year return sits at 106.0%.
- Recent coverage around Brookfield Asset Management has focused on its role as a large global alternative asset manager and how that positioning influences investor expectations. This context helps frame why the share price has shown these returns across different time frames and why opinions on its risk and return profile can differ.
- On Simply Wall St's 6 point valuation check, Brookfield Asset Management scores 1 out of 6, so next we will look at what traditional valuation methods say about the stock and then finish with a more holistic way to think about its value.
Brookfield Asset Management scores just 1/6 on our valuation checks. See what other red flags we found in the full valuation breakdown.
Approach 1: Brookfield Asset Management Excess Returns Analysis
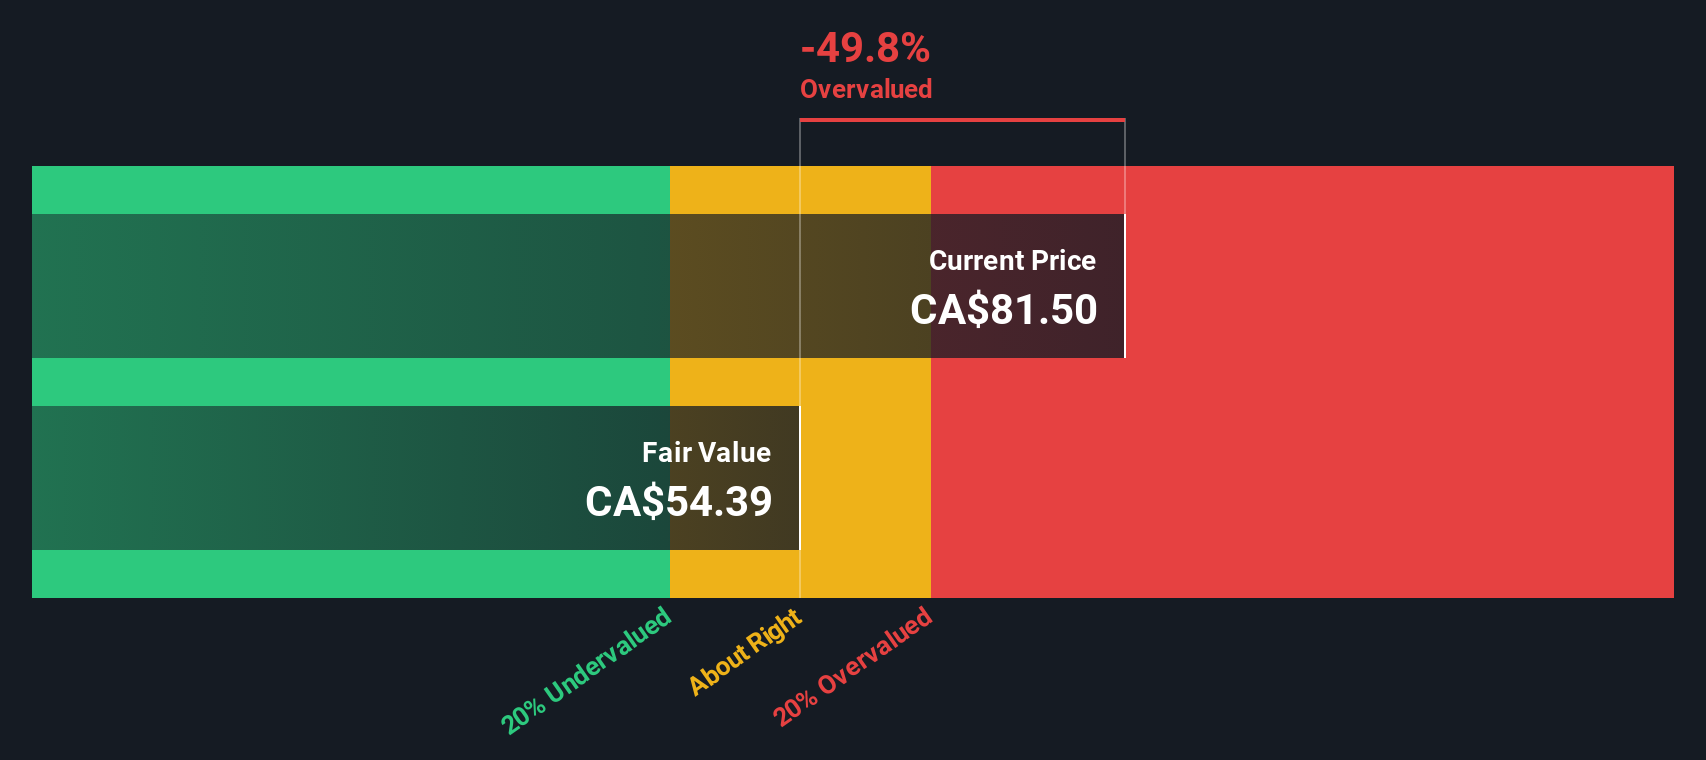
The Excess Returns model looks at how efficiently Brookfield Asset Management turns shareholder capital into earnings, and what portion of those earnings is above the cost of that equity. Put simply, it asks whether the company is earning more on its equity than investors require, and then projects those excess returns into the future.
For Brookfield Asset Management, the model uses a Book Value of CA$5.25 per share and a Stable EPS of CA$2.17 per share, based on weighted future Return on Equity estimates from 4 analysts. The Average Return on Equity is 34.99%, while the Cost of Equity is CA$0.47 per share. The difference between these, the Excess Return, is CA$1.70 per share, and the Stable Book Value is CA$6.20 per share, based on weighted future Book Value estimates from 4 analysts.
Using these inputs, the Excess Returns model arrives at an intrinsic value of CA$56.48 per share. Compared with the recent share price of CA$75.37, this implies Brookfield Asset Management is about 33.4% overvalued according to this method.
Result: OVERVALUED
Our Excess Returns analysis suggests Brookfield Asset Management may be overvalued by 33.4%. Discover 882 undervalued stocks or create your own screener to find better value opportunities.
Approach 2: Brookfield Asset Management Price vs Earnings
For a profitable company, the P/E ratio is a useful way to think about what you are paying for each dollar of earnings, which makes it a common shorthand for how the market is pricing the business today.
In general, higher growth expectations and lower perceived risk can support a higher P/E ratio, while slower expected growth or higher risk usually line up with a lower, more cautious P/E. So context really matters when you look at the headline multiple.
Brookfield Asset Management currently trades on a P/E of 33.76x. That sits above the Capital Markets industry average P/E of 9.41x, although below the peer average of 53.50x for the group Simply Wall St uses for comparison. To refine this, Simply Wall St calculates a “Fair Ratio” of 23.81x, which is the P/E they would expect for Brookfield Asset Management given factors such as its earnings profile, industry, profit margins, size and risk characteristics.
This Fair Ratio is more tailored than a simple industry or peer comparison, because it attempts to adjust for differences in growth, risk and business quality rather than assuming all companies deserve similar multiples. Compared with the current P/E of 33.76x, the Fair Ratio of 23.81x suggests the shares are trading at a richer level than this framework would indicate.
Result: OVERVALUED
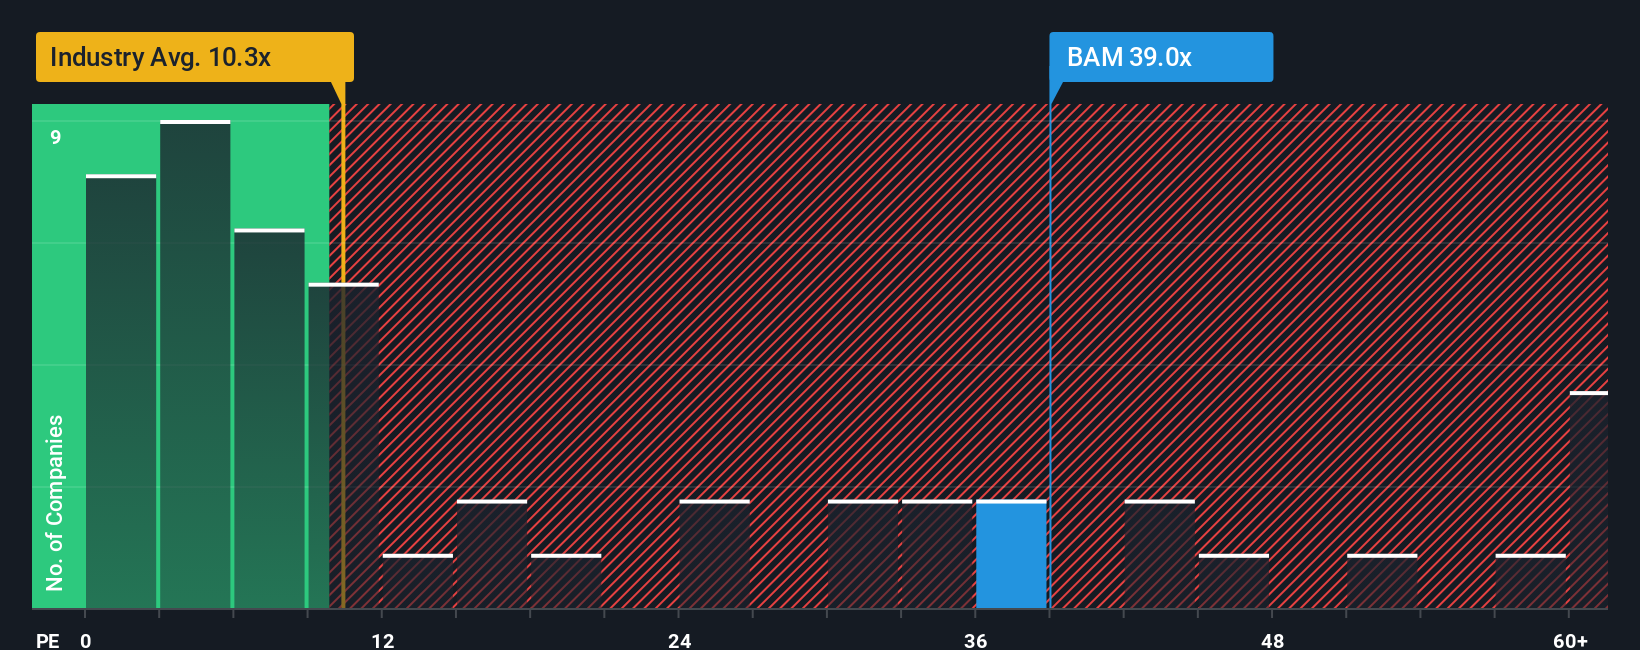
P/E ratios tell one story, but what if the real opportunity lies elsewhere? Discover 1450 companies where insiders are betting big on explosive growth.
Upgrade Your Decision Making: Choose your Brookfield Asset Management Narrative
Earlier we mentioned that there is an even better way to understand valuation, so let us introduce you to Narratives. Narratives let you attach a clear story, your view of a company, to the numbers such as fair value and your assumptions for future revenue, earnings and margins.
A Narrative connects three things: the company story you believe, the financial forecast that story implies, and the fair value that results from those assumptions.
On Simply Wall St, Narratives sit inside the Community page and are designed to be easy to use. This means you can quickly see how your view of Brookfield Asset Management compares with others on the platform used by millions of investors.
Each Narrative pairs a Fair Value with the current share price to help you decide whether the gap between value and price is large enough for you to consider buying or selling, and it automatically updates as new information such as news or earnings is added to the system.
For Brookfield Asset Management, one investor might publish a Narrative that sees a much higher fair value based on optimistic assumptions, while another might share a Narrative with a far lower fair value based on more cautious expectations.
Do you think there's more to the story for Brookfield Asset Management? Head over to our Community to see what others are saying!
This article by Simply Wall St is general in nature. We provide commentary based on historical data and analyst forecasts only using an unbiased methodology and our articles are not intended to be financial advice. It does not constitute a recommendation to buy or sell any stock, and does not take account of your objectives, or your financial situation. We aim to bring you long-term focused analysis driven by fundamental data. Note that our analysis may not factor in the latest price-sensitive company announcements or qualitative material. Simply Wall St has no position in any stocks mentioned.
Have feedback on this article? Concerned about the content? Get in touch with us directly. Alternatively, email editorial-team@simplywallst.com