
 Nasdaq
 華爾街日報
華爾街日報Is Lumen Technologies (LUMN) Price Justified After Mixed Returns And Cash Flow Concerns
- If you are wondering whether Lumen Technologies at around US$7.57 is a bargain or a value trap, you are not alone. This article will focus on what the numbers actually suggest about the stock's value.
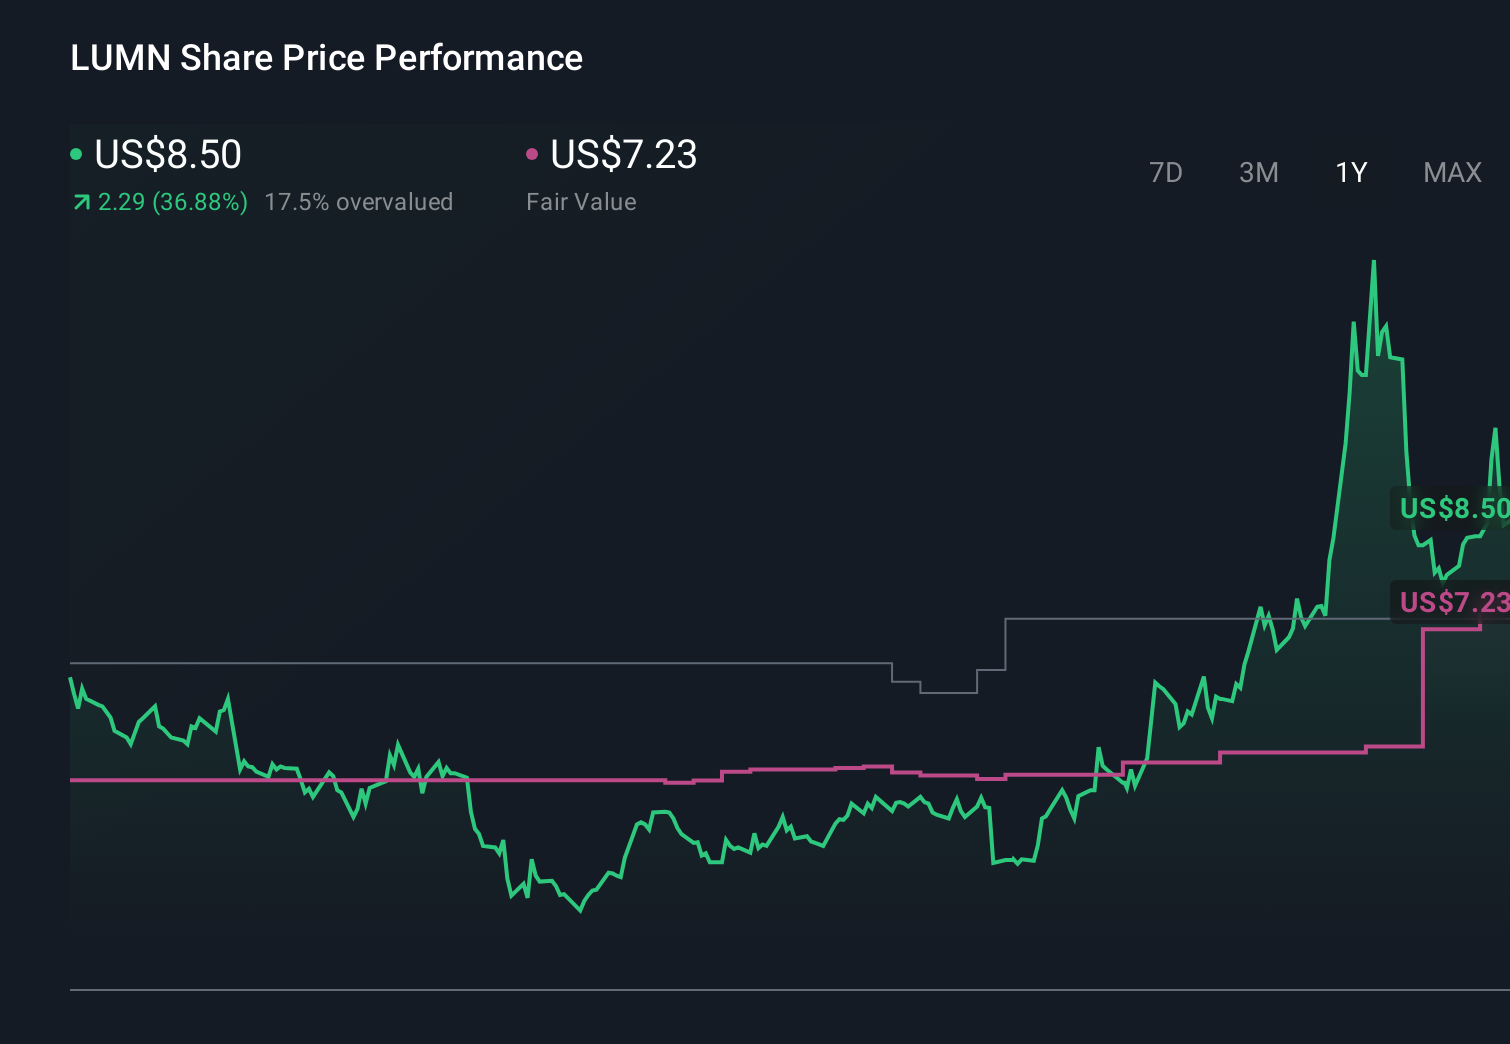
- The share price has had mixed returns, with a 3.2% decline over the last 7 days and an 8.4% decline over 30 days, while the 1 year return sits at 36.4% and the 3 year return at 35.2%, compared with a 5 year return of an 18.5% decline.
- Recent coverage around Lumen has largely focused on its ongoing efforts to reshape the business and address its balance sheet, as investors weigh up the implications for future cash flows and risk. These developments help explain why sentiment and the share price have moved around over different timeframes.
- Lumen currently scores 3 out of 6 on our valuation checks, meaning it appears undervalued on half of the metrics we review. You can see that full breakdown in our valuation score. Next we will look at how approaches like discounted cash flow and multiples compare, and then finish with a more complete way to think about the stock's value beyond any single model.
Approach 1: Lumen Technologies Discounted Cash Flow (DCF) Analysis
A Discounted Cash Flow, or DCF, model projects a company’s future cash flows and then discounts them back to today’s dollars to estimate what the business might be worth right now.
For Lumen Technologies, the model used is a 2 Stage Free Cash Flow to Equity approach, based on cash flow projections. The latest twelve month free cash flow sits at about $1.79b. Analysts provide explicit forecasts for the next few years, and Simply Wall St then extrapolates those further out. In this case, projected free cash flow for 2030 is $626 million, with intermediate years including both positive and negative figures. This is reflected in the discounted ten year cash flow schedule.
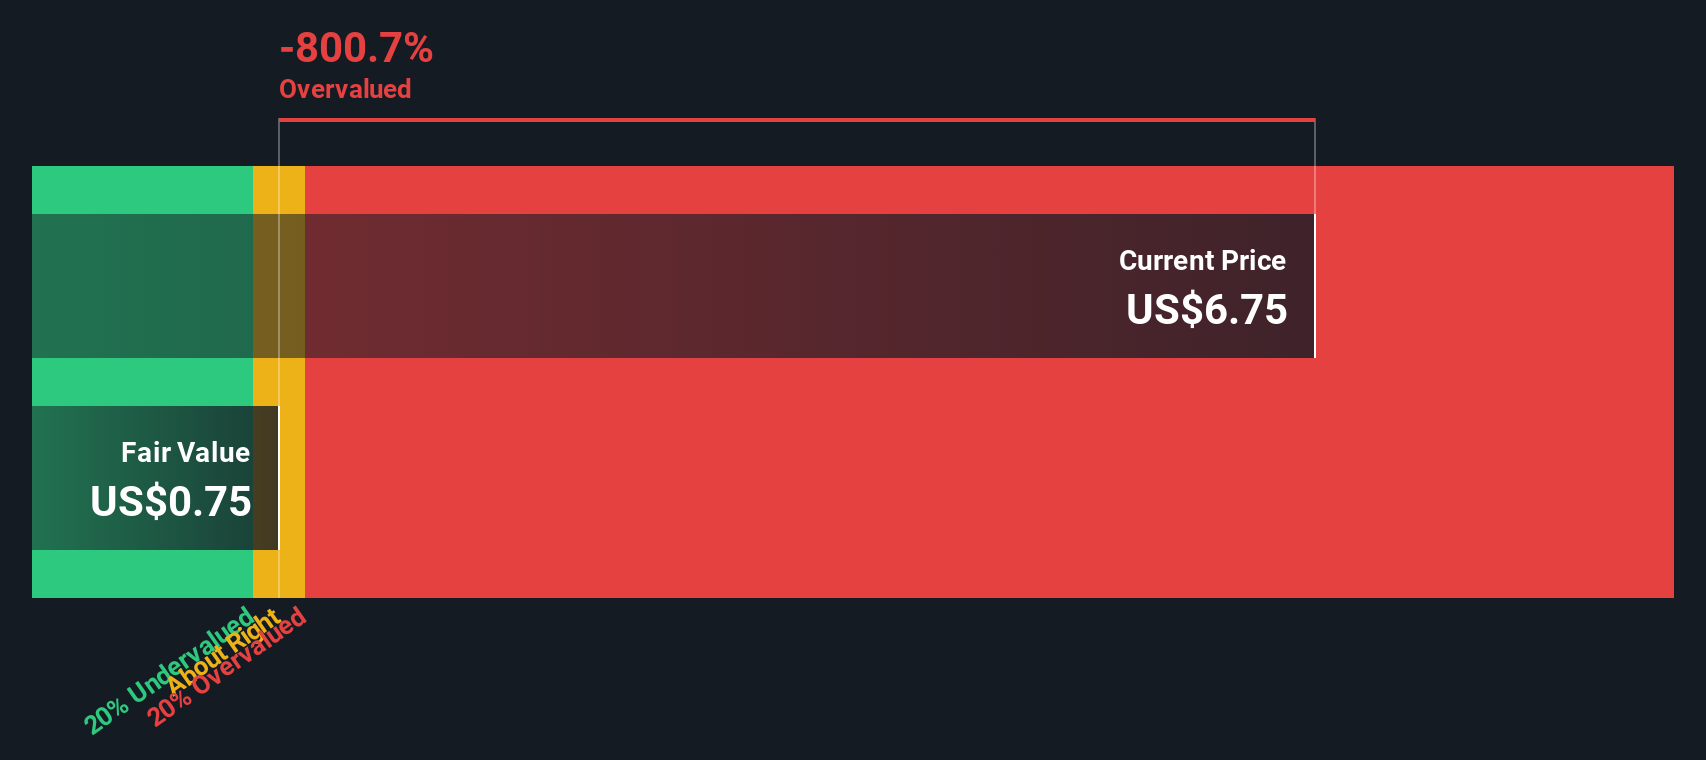
When those projected cash flows are discounted back, the DCF model produces an estimated fair value of about $6.10 per share. Compared with the recent share price of around $7.57, this implies the stock screens as roughly 24.1% overvalued on this method.
Result: OVERVALUED
Our Discounted Cash Flow (DCF) analysis suggests Lumen Technologies may be overvalued by 24.1%. Discover 882 undervalued stocks or create your own screener to find better value opportunities.
Approach 2: Lumen Technologies Price vs Sales
For companies where earnings are weak or volatile, the P/S ratio is often more useful than P/E, because it compares the share price to revenue, which tends to be more stable. Investors generally accept higher P/S multiples when they expect stronger growth and lower risk, and lower multiples when growth is uncertain or risk is higher.
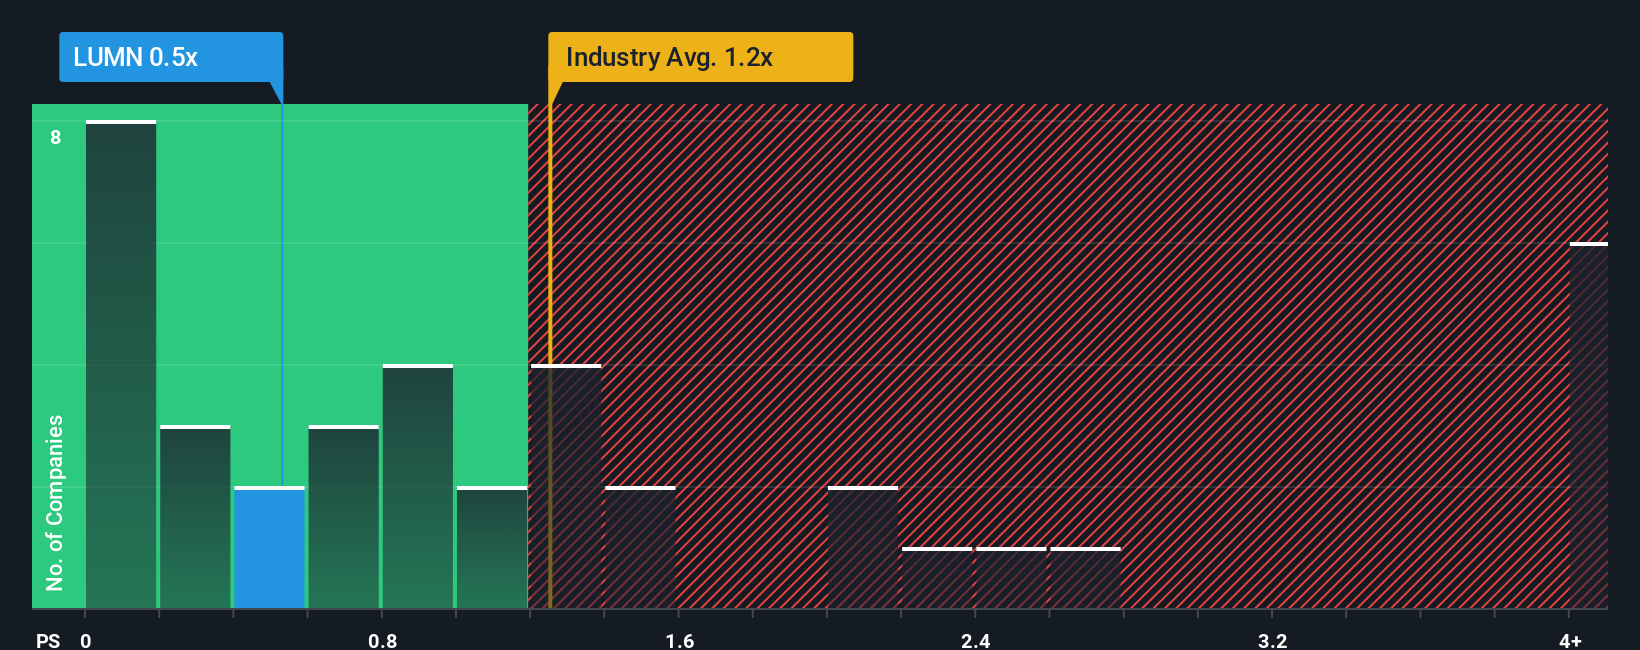
Lumen Technologies currently trades on a P/S ratio of 0.61x. That sits below the Telecom industry average P/S of 1.25x and well below the peer group average of 8.37x. On those simple comparisons, the shares look inexpensive relative to many other companies in the space.
Simply Wall St also computes a proprietary “Fair Ratio” for the preferred multiple, which is 1.42x for Lumen. This Fair Ratio reflects factors like earnings growth, industry, profit margins, market cap and specific risks, so it gives a more tailored reference point than broad industry or peer averages alone. Comparing the current 0.61x P/S to the 1.42x Fair Ratio suggests the shares are priced below what this framework would indicate.
Result: UNDERVALUED
P/S ratios tell one story, but what if the real opportunity lies elsewhere? Discover 1452 companies where insiders are betting big on explosive growth.
Upgrade Your Decision Making: Choose your Lumen Technologies Narrative
Earlier we mentioned that there is an even better way to understand valuation. Let us introduce you to Narratives, which are simple stories you create about a company like Lumen Technologies that connect your view of its future revenue, earnings and margins to a financial forecast, a fair value, and then a clear comparison with today’s price. All of this is available within an easy tool on Simply Wall St’s Community page that updates when new news or earnings arrive. You can see, for example, one investor building a Narrative around the higher US$8.33 price target with improving profitability, and another around the lower US$2.00 view with ongoing revenue and execution risks, and then decide for yourself which story, and resulting fair value versus price gap, you agree with.
Do you think there's more to the story for Lumen Technologies? Head over to our Community to see what others are saying!
This article by Simply Wall St is general in nature. We provide commentary based on historical data and analyst forecasts only using an unbiased methodology and our articles are not intended to be financial advice. It does not constitute a recommendation to buy or sell any stock, and does not take account of your objectives, or your financial situation. We aim to bring you long-term focused analysis driven by fundamental data. Note that our analysis may not factor in the latest price-sensitive company announcements or qualitative material. Simply Wall St has no position in any stocks mentioned.
Have feedback on this article? Concerned about the content? Get in touch with us directly. Alternatively, email editorial-team@simplywallst.com