
 Nasdaq
 華爾街日報
華爾街日報What BuildDirect.com Technologies Inc.'s (CVE:BILD) P/S Is Not Telling You
With a median price-to-sales (or "P/S") ratio of close to 1.4x in the Specialty Retail industry in Canada, you could be forgiven for feeling indifferent about BuildDirect.com Technologies Inc.'s (CVE:BILD) P/S ratio, which comes in at about the same. While this might not raise any eyebrows, if the P/S ratio is not justified investors could be missing out on a potential opportunity or ignoring looming disappointment.
See our latest analysis for BuildDirect.com Technologies
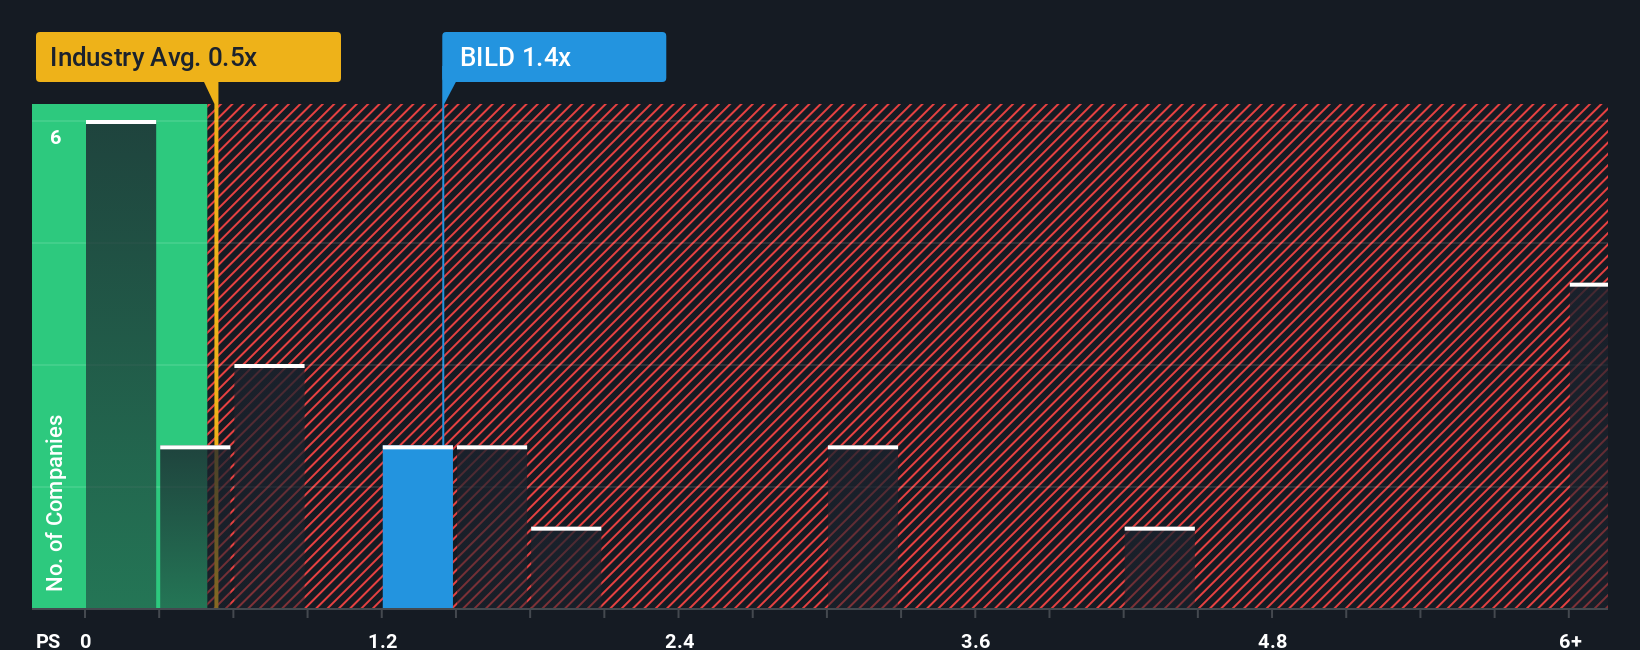
How BuildDirect.com Technologies Has Been Performing
We'd have to say that with no tangible growth over the last year, BuildDirect.com Technologies' revenue has been unimpressive. One possibility is that the P/S is moderate because investors think this benign revenue growth rate might not be enough to outperform the broader industry in the near future. Those who are bullish on BuildDirect.com Technologies will be hoping that this isn't the case, so that they can pick up the stock at a lower valuation.
Want the full picture on earnings, revenue and cash flow for the company? Then our free report on BuildDirect.com Technologies will help you shine a light on its historical performance.Is There Some Revenue Growth Forecasted For BuildDirect.com Technologies?
The only time you'd be comfortable seeing a P/S like BuildDirect.com Technologies' is when the company's growth is tracking the industry closely.
Retrospectively, the last year delivered virtually the same number to the company's top line as the year before. Whilst it's an improvement, it wasn't enough to get the company out of the hole it was in, with revenue down 29% overall from three years ago. So unfortunately, we have to acknowledge that the company has not done a great job of growing revenue over that time.
In contrast to the company, the rest of the industry is expected to grow by 17% over the next year, which really puts the company's recent medium-term revenue decline into perspective.
In light of this, it's somewhat alarming that BuildDirect.com Technologies' P/S sits in line with the majority of other companies. Apparently many investors in the company are way less bearish than recent times would indicate and aren't willing to let go of their stock right now. There's a good chance existing shareholders are setting themselves up for future disappointment if the P/S falls to levels more in line with the recent negative growth rates.
What We Can Learn From BuildDirect.com Technologies' P/S?
Typically, we'd caution against reading too much into price-to-sales ratios when settling on investment decisions, though it can reveal plenty about what other market participants think about the company.
We find it unexpected that BuildDirect.com Technologies trades at a P/S ratio that is comparable to the rest of the industry, despite experiencing declining revenues during the medium-term, while the industry as a whole is expected to grow. Even though it matches the industry, we're uncomfortable with the current P/S ratio, as this dismal revenue performance is unlikely to support a more positive sentiment for long. Unless the the circumstances surrounding the recent medium-term improve, it wouldn't be wrong to expect a a difficult period ahead for the company's shareholders.
It's always necessary to consider the ever-present spectre of investment risk. We've identified 1 warning sign with BuildDirect.com Technologies, and understanding should be part of your investment process.
If you're unsure about the strength of BuildDirect.com Technologies' business, why not explore our interactive list of stocks with solid business fundamentals for some other companies you may have missed.
Have feedback on this article? Concerned about the content? Get in touch with us directly. Alternatively, email editorial-team (at) simplywallst.com.
This article by Simply Wall St is general in nature. We provide commentary based on historical data and analyst forecasts only using an unbiased methodology and our articles are not intended to be financial advice. It does not constitute a recommendation to buy or sell any stock, and does not take account of your objectives, or your financial situation. We aim to bring you long-term focused analysis driven by fundamental data. Note that our analysis may not factor in the latest price-sensitive company announcements or qualitative material. Simply Wall St has no position in any stocks mentioned.