
 Nasdaq
 華爾街日報
華爾街日報Are Alphatec Holdings, Inc. (NASDAQ:ATEC) Investors Paying Above The Intrinsic Value?
Key Insights
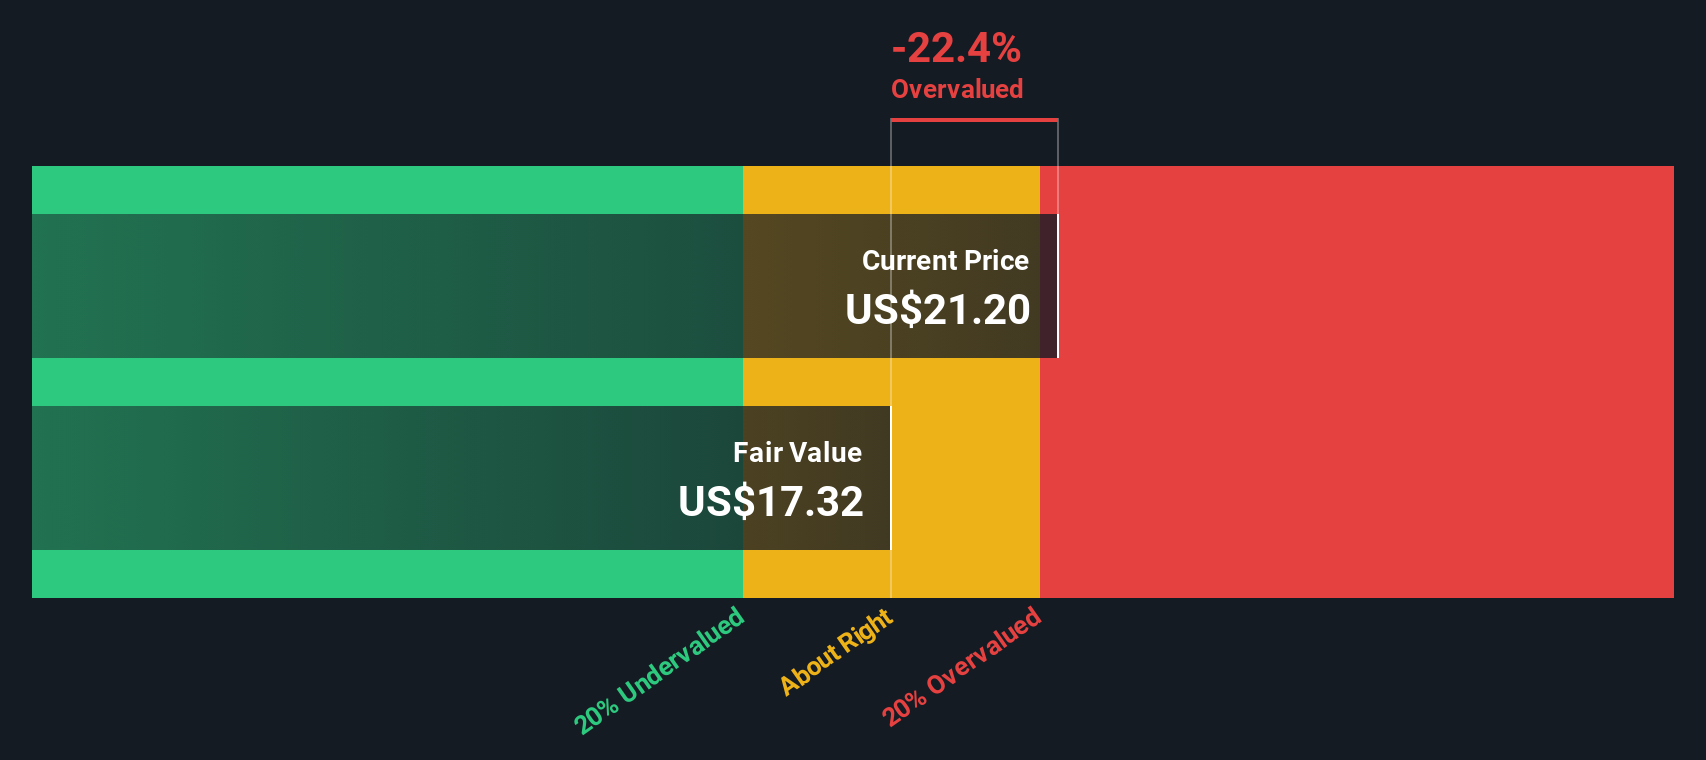
- Alphatec Holdings' estimated fair value is US$17.32 based on 2 Stage Free Cash Flow to Equity
- Alphatec Holdings' US$21.20 share price signals that it might be 22% overvalued
- Our fair value estimate is 30% lower than Alphatec Holdings' analyst price target of US$24.62
Today we will run through one way of estimating the intrinsic value of Alphatec Holdings, Inc. (NASDAQ:ATEC) by taking the forecast future cash flows of the company and discounting them back to today's value. The Discounted Cash Flow (DCF) model is the tool we will apply to do this. There's really not all that much to it, even though it might appear quite complex.
Companies can be valued in a lot of ways, so we would point out that a DCF is not perfect for every situation. If you still have some burning questions about this type of valuation, take a look at the Simply Wall St analysis model.
Crunching The Numbers
We are going to use a two-stage DCF model, which, as the name states, takes into account two stages of growth. The first stage is generally a higher growth period which levels off heading towards the terminal value, captured in the second 'steady growth' period. In the first stage we need to estimate the cash flows to the business over the next ten years. Where possible we use analyst estimates, but when these aren't available we extrapolate the previous free cash flow (FCF) from the last estimate or reported value. We assume companies with shrinking free cash flow will slow their rate of shrinkage, and that companies with growing free cash flow will see their growth rate slow, over this period. We do this to reflect that growth tends to slow more in the early years than it does in later years.
Generally we assume that a dollar today is more valuable than a dollar in the future, so we need to discount the sum of these future cash flows to arrive at a present value estimate:
10-year free cash flow (FCF) estimate
| 2026 | 2027 | 2028 | 2029 | 2030 | 2031 | 2032 | 2033 | 2034 | 2035 | |
| Levered FCF ($, Millions) | US$46.5m | US$70.8m | US$90.4m | US$108.8m | US$125.4m | US$139.9m | US$152.7m | US$163.9m | US$174.0m | US$183.2m |
| Growth Rate Estimate Source | Analyst x3 | Analyst x2 | Est @ 27.68% | Est @ 20.35% | Est @ 15.22% | Est @ 11.63% | Est @ 9.12% | Est @ 7.36% | Est @ 6.13% | Est @ 5.27% |
| Present Value ($, Millions) Discounted @ 8.1% | US$43.0 | US$60.6 | US$71.6 | US$79.7 | US$85.0 | US$87.7 | US$88.6 | US$88.0 | US$86.4 | US$84.1 |
("Est" = FCF growth rate estimated by Simply Wall St)
Present Value of 10-year Cash Flow (PVCF) = US$775m
The second stage is also known as Terminal Value, this is the business's cash flow after the first stage. The Gordon Growth formula is used to calculate Terminal Value at a future annual growth rate equal to the 5-year average of the 10-year government bond yield of 3.3%. We discount the terminal cash flows to today's value at a cost of equity of 8.1%.
Terminal Value (TV)= FCF2035 × (1 + g) ÷ (r – g) = US$183m× (1 + 3.3%) ÷ (8.1%– 3.3%) = US$3.9b
Present Value of Terminal Value (PVTV)= TV / (1 + r)10= US$3.9b÷ ( 1 + 8.1%)10= US$1.8b
The total value is the sum of cash flows for the next ten years plus the discounted terminal value, which results in the Total Equity Value, which in this case is US$2.6b. The last step is to then divide the equity value by the number of shares outstanding. Relative to the current share price of US$21.2, the company appears slightly overvalued at the time of writing. Remember though, that this is just an approximate valuation, and like any complex formula - garbage in, garbage out.
The Assumptions
Now the most important inputs to a discounted cash flow are the discount rate, and of course, the actual cash flows. Part of investing is coming up with your own evaluation of a company's future performance, so try the calculation yourself and check your own assumptions. The DCF also does not consider the possible cyclicality of an industry, or a company's future capital requirements, so it does not give a full picture of a company's potential performance. Given that we are looking at Alphatec Holdings as potential shareholders, the cost of equity is used as the discount rate, rather than the cost of capital (or weighted average cost of capital, WACC) which accounts for debt. In this calculation we've used 8.1%, which is based on a levered beta of 1.046. Beta is a measure of a stock's volatility, compared to the market as a whole. We get our beta from the industry average beta of globally comparable companies, with an imposed limit between 0.8 and 2.0, which is a reasonable range for a stable business.
Check out our latest analysis for Alphatec Holdings
SWOT Analysis for Alphatec Holdings
- No major strengths identified for ATEC.
- Expensive based on P/S ratio and estimated fair value.
- Forecast to reduce losses next year.
- Has sufficient cash runway for more than 3 years based on current free cash flows.
- Debt is not well covered by operating cash flow.
Looking Ahead:
Although the valuation of a company is important, it shouldn't be the only metric you look at when researching a company. The DCF model is not a perfect stock valuation tool. Preferably you'd apply different cases and assumptions and see how they would impact the company's valuation. If a company grows at a different rate, or if its cost of equity or risk free rate changes sharply, the output can look very different. What is the reason for the share price exceeding the intrinsic value? For Alphatec Holdings, there are three relevant aspects you should consider:
- Risks: As an example, we've found 1 warning sign for Alphatec Holdings that you need to consider before investing here.
- Future Earnings: How does ATEC's growth rate compare to its peers and the wider market? Dig deeper into the analyst consensus number for the upcoming years by interacting with our free analyst growth expectation chart.
- Other High Quality Alternatives: Do you like a good all-rounder? Explore our interactive list of high quality stocks to get an idea of what else is out there you may be missing!
PS. Simply Wall St updates its DCF calculation for every American stock every day, so if you want to find the intrinsic value of any other stock just search here.
Have feedback on this article? Concerned about the content? Get in touch with us directly. Alternatively, email editorial-team (at) simplywallst.com.
This article by Simply Wall St is general in nature. We provide commentary based on historical data and analyst forecasts only using an unbiased methodology and our articles are not intended to be financial advice. It does not constitute a recommendation to buy or sell any stock, and does not take account of your objectives, or your financial situation. We aim to bring you long-term focused analysis driven by fundamental data. Note that our analysis may not factor in the latest price-sensitive company announcements or qualitative material. Simply Wall St has no position in any stocks mentioned.