
 Nasdaq
 華爾街日報
華爾街日報Assessing Janus Henderson Group (JHG) Valuation After Recent Share Price Momentum And Mixed Fair Value Signals
What Janus Henderson Group’s recent performance tells investors
Janus Henderson Group (NYSE:JHG) has moved quietly but steadily on the market, with the stock up over the past month and past 3 months, raising questions about how current pricing lines up with fundamentals.
See our latest analysis for Janus Henderson Group.
Recent trading tells a mixed story, with a 30 day share price return of 6.84% alongside a year to date share price return close to flat. At the same time, the 1 year total shareholder return of 18.13% and 3 year total shareholder return of about 2x suggest longer term holders have seen stronger momentum than short term traders.
If Janus Henderson Group has you thinking about where else capital might work hard, this could be a good moment to broaden your search with fast growing stocks with high insider ownership.
With Janus Henderson Group trading near analyst targets and recent returns already strong, the key question is whether the current valuation still leaves upside on the table or whether the market is already pricing in future growth.
Most Popular Narrative: 4.5% Undervalued
With Janus Henderson Group last closing at $47.77 against a narrative fair value of $50.00, the current price sits slightly below that reference point.
The analysts have a consensus price target of $45.556 for Janus Henderson Group based on their expectations of its future earnings growth, profit margins and other risk factors. However, there is a degree of disagreement amongst analysts, with the most bullish reporting a price target of $54.0, and the most bearish reporting a price target of just $38.0.
Curious what revenue path, profit margin profile, and future earnings multiple have to line up to justify that fair value? The underlying assumptions may surprise you.
Result: Fair Value of $50 (UNDERVALUED)
Have a read of the narrative in full and understand what's behind the forecasts.
However, there are still real pressure points to watch, particularly ongoing client outflows from active strategies and fee compression that could cap margins and earnings power.
Find out about the key risks to this Janus Henderson Group narrative.
Another View: What Our DCF Says
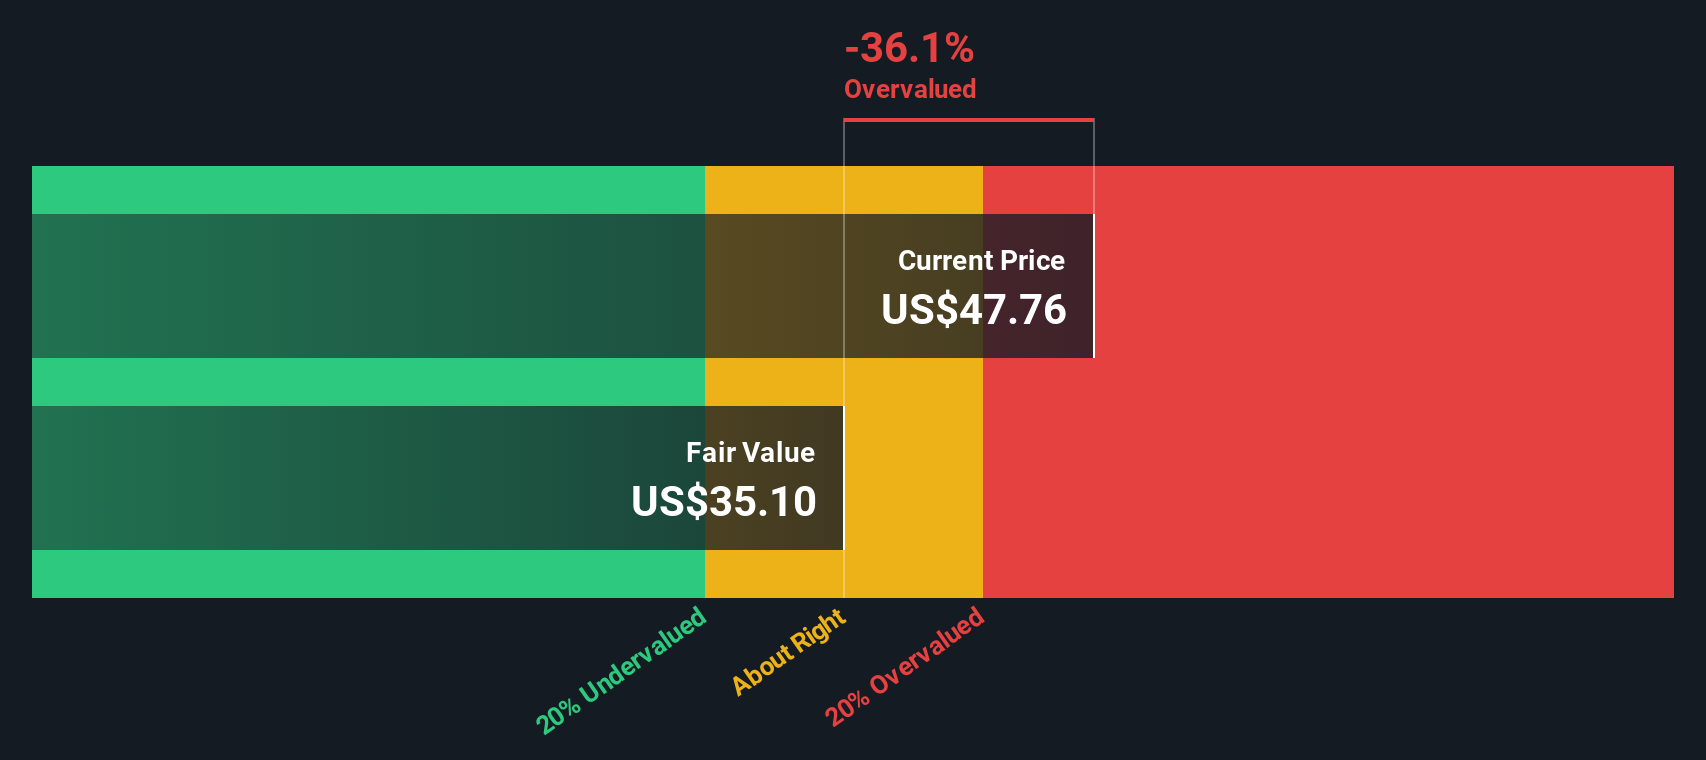
Our SWS DCF model paints a different picture to the narrative fair value. On this view, Janus Henderson Group at $47.77 sits above an estimated fair value of $34.96, so the shares screen as overvalued rather than slightly undervalued. It raises a simple question: which set of assumptions do you trust more?
Look into how the SWS DCF model arrives at its fair value.
Simply Wall St performs a discounted cash flow (DCF) on every stock in the world every day (check out Janus Henderson Group for example). We show the entire calculation in full. You can track the result in your watchlist or portfolio and be alerted when this changes, or use our stock screener to discover 878 undervalued stocks based on their cash flows. If you save a screener we even alert you when new companies match - so you never miss a potential opportunity.
Build Your Own Janus Henderson Group Narrative
If you look at these numbers and reach a different conclusion, or simply prefer to test the assumptions yourself, you can frame your own view in just a few minutes with Do it your way.
A good starting point is our analysis highlighting 3 key rewards investors are optimistic about regarding Janus Henderson Group.
Ready to hunt for more investment ideas?
If Janus Henderson Group has sharpened your thinking, do not stop here. Widen your watchlist now so you are not playing catch up later.
- Target stronger cash flow potential by scanning these 878 undervalued stocks based on cash flows that might offer earnings power the market has not fully reflected yet.
- Tap into future tech themes by checking these 25 AI penny stocks where artificial intelligence sits at the center of each company’s story.
- Strengthen your income stream by reviewing these 14 dividend stocks with yields > 3% that combine yield with business fundamentals you can actually assess.
This article by Simply Wall St is general in nature. We provide commentary based on historical data and analyst forecasts only using an unbiased methodology and our articles are not intended to be financial advice. It does not constitute a recommendation to buy or sell any stock, and does not take account of your objectives, or your financial situation. We aim to bring you long-term focused analysis driven by fundamental data. Note that our analysis may not factor in the latest price-sensitive company announcements or qualitative material. Simply Wall St has no position in any stocks mentioned.
Have feedback on this article? Concerned about the content? Get in touch with us directly. Alternatively, email editorial-team@simplywallst.com