
 Nasdaq
 華爾街日報
華爾街日報Assessing HSBC Holdings (LSE:HSBA) Valuation After Strong 1 Year Shareholder Returns
HSBC Holdings (LSE:HSBA) has drawn investor attention after recent share price moves, with the stock showing gains over the past month and the past three months. This has prompted a closer look at its current valuation.
See our latest analysis for HSBC Holdings.
Beyond the recent monthly gains, HSBC Holdings has a 90 day share price return of 14.97%, while its 1 year total shareholder return of 62.31% points to strong momentum building over a longer horizon.
If HSBC’s recent move has caught your eye, it could be a good moment to see what else is moving and check out aerospace and defense stocks as a fresh hunting ground.
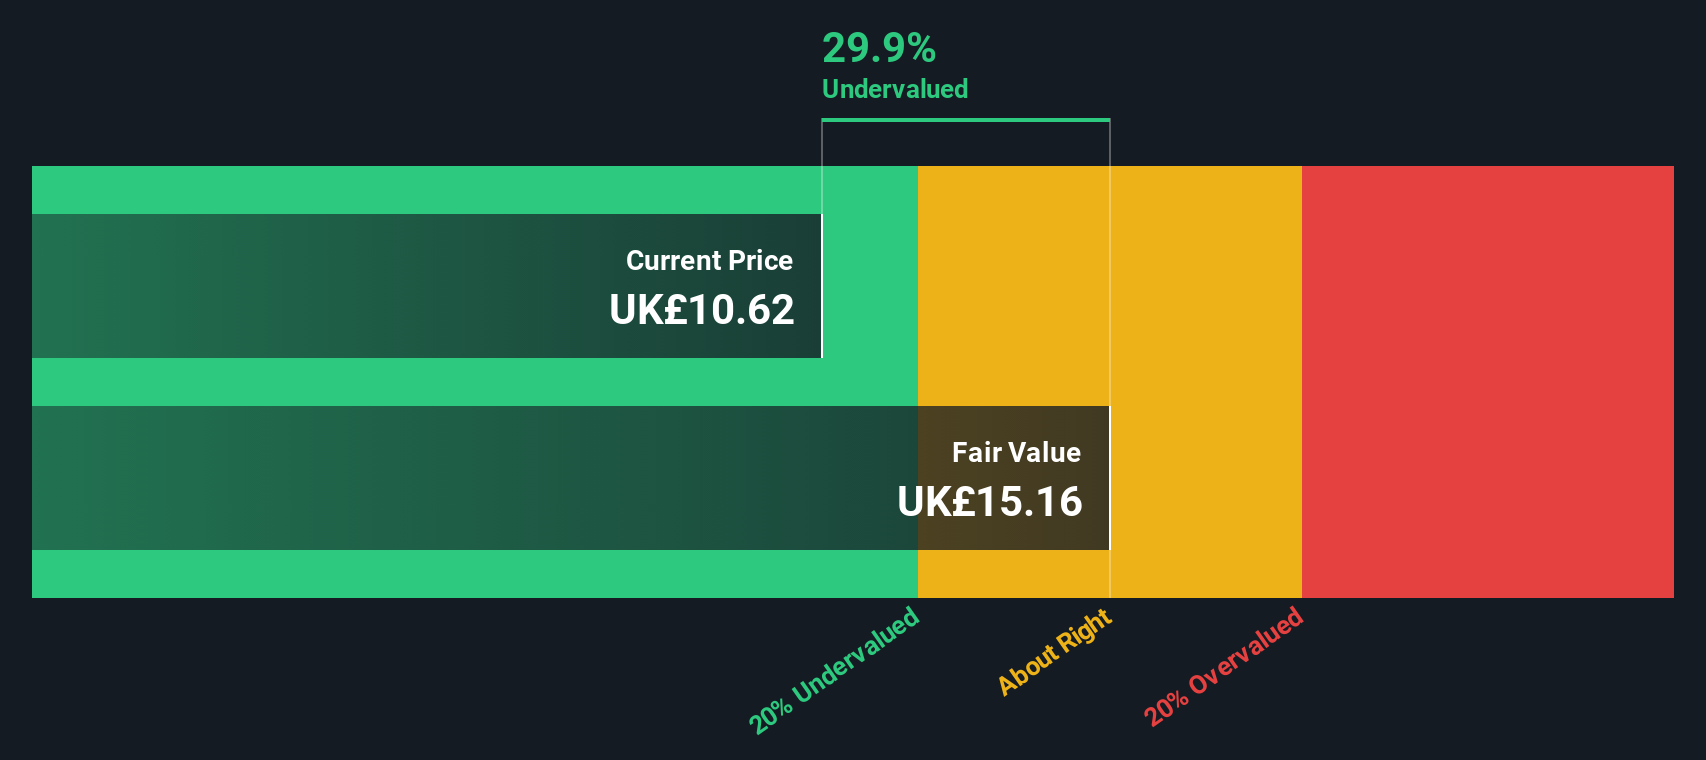
HSBC now trades around £12.07, with an estimated intrinsic value suggesting roughly a 30% discount, yet it also sits above its average analyst price target. Is there still value on the table, or is the market already pricing in future growth?
Most Popular Narrative: 10.9% Overvalued
Compared with HSBC Holdings' last close of £12.07, the most followed narrative points to a fair value that sits noticeably lower, framing the current valuation debate.
The strategic shift away from underperforming and non-core businesses in Europe and the Americas, and redeployment of capital into high-return businesses in Asia and the Middle East, is expected to improve overall net interest margins and boost group return on equity through better allocation of resources. Disproportionate investment in digital transformation, including AI-driven efficiency gains and digital onboarding, will generate structural cost reductions, directly improving the cost-to-income ratio and lifting long-term operating leverage and net margins.
Want to understand how double digit revenue growth assumptions, rising profit margins and a richer future P/E multiple all combine into that fair value call? The full narrative lays out the earnings path, the margin rebuild and the valuation multiple that ties those moving parts together. If you care about how those inputs balance against a discount rate above 10%, this is where the details live.
Result: Fair Value of £10.88 (OVERVALUED)
Have a read of the narrative in full and understand what's behind the forecasts.
However, this depends on Asian-led growth remaining resilient and on risks in Hong Kong commercial real estate not driving credit costs higher than analysts currently expect.
Find out about the key risks to this HSBC Holdings narrative.
Another View: DCF Points To Undervaluation
The most followed narrative sees HSBC Holdings as about 10.9% overvalued at a fair value of £10.88, yet our DCF model points in the opposite direction. In this alternative view, the shares at £12.07 sit around 30.1% below an estimated fair value of £17.27. This difference in perspective raises a different question for you to consider.
Look into how the SWS DCF model arrives at its fair value.
Simply Wall St performs a discounted cash flow (DCF) on every stock in the world every day (check out HSBC Holdings for example). We show the entire calculation in full. You can track the result in your watchlist or portfolio and be alerted when this changes, or use our stock screener to discover 878 undervalued stocks based on their cash flows. If you save a screener we even alert you when new companies match - so you never miss a potential opportunity.
Build Your Own HSBC Holdings Narrative
If you look at these numbers and reach a different conclusion, or simply prefer to test your own assumptions, you can build a custom view in minutes by starting with Do it your way.
A great starting point for your HSBC Holdings research is our analysis highlighting 2 key rewards and 3 important warning signs that could impact your investment decision.
Looking for more investment ideas?
If HSBC is already on your radar, do not stop there. Widening your watchlist with different themes can help you spot opportunities you might otherwise miss.
- Target potential value by scanning these 878 undervalued stocks based on cash flows that the market may be pricing conservatively based on their cash flows.
- Tap into emerging trends by checking out these 25 AI penny stocks that are tied to artificial intelligence and related technologies.
- Strengthen your income focus by assessing these 14 dividend stocks with yields > 3% that could support a dividend-led approach to your portfolio.
This article by Simply Wall St is general in nature. We provide commentary based on historical data and analyst forecasts only using an unbiased methodology and our articles are not intended to be financial advice. It does not constitute a recommendation to buy or sell any stock, and does not take account of your objectives, or your financial situation. We aim to bring you long-term focused analysis driven by fundamental data. Note that our analysis may not factor in the latest price-sensitive company announcements or qualitative material. Simply Wall St has no position in any stocks mentioned.
Have feedback on this article? Concerned about the content? Get in touch with us directly. Alternatively, email editorial-team@simplywallst.com