
 Nasdaq
 華爾街日報
華爾街日報Assessing Qnity Electronics (Q) Valuation After Fresh Focus On Semiconductor Supply Chain Role
Qnity Electronics (Q) has attracted fresh attention after detailing its role supplying materials and solutions across global semiconductor and electronics markets, prompting investors to reassess the stock around its recent $85.11 close.
See our latest analysis for Qnity Electronics.
The recent 1-month share price return of 3.74% suggests momentum has been building around Qnity Electronics, as investors react to its semiconductor materials exposure and reassess the stock near its $85.11 level.
If Qnity’s role in chip supply chains has caught your attention, this could be a good moment to compare it with other high growth tech and AI stocks that are catching market interest.
With Qnity Electronics reporting annual revenue of $4.665b and net income of $805.0m, and the shares recently at $85.11 alongside a mixed picture from valuation models, you have to ask: is there still an opportunity here, or is the market already pricing in future growth?
Price-to-Earnings of 22.1x: Is it justified?
Against Qnity Electronics' recent US$85.11 close, a P/E of 22.1x stands out as lower than both peers and the wider US semiconductor group.
The P/E ratio compares the current share price with earnings per share, so for a company like Qnity Electronics it reflects what investors are currently paying for each dollar of earnings.
For Qnity, the signals are mixed. On one hand, high quality earnings, a 24.6% earnings growth figure over the past year and higher net profit margins compared with last year suggest investors are paying for a business that is already producing solid profitability. At the same time, forecasts of 9.2% annual earnings growth and 5.8% annual revenue growth that sit below broader US market expectations indicate the market is not attaching a premium multiple for faster growth.
Where it really stands out is in the comparison set. Qnity Electronics is flagged as good value on a 22.1x P/E against a peer average of 51.9x and a US semiconductor industry average of 37.3x, a clear discount to what investors are currently paying for similar earnings elsewhere in the sector.
See what the numbers say about this price — find out in our valuation breakdown.
Result: Price-to-Earnings of 22.1x (ABOUT RIGHT)
However, there are risks, including Qnity’s dependence on cyclical semiconductor demand and the possibility that its 22.1x P/E already reflects optimistic expectations.
Find out about the key risks to this Qnity Electronics narrative.
Another View: DCF Points to a Different Story
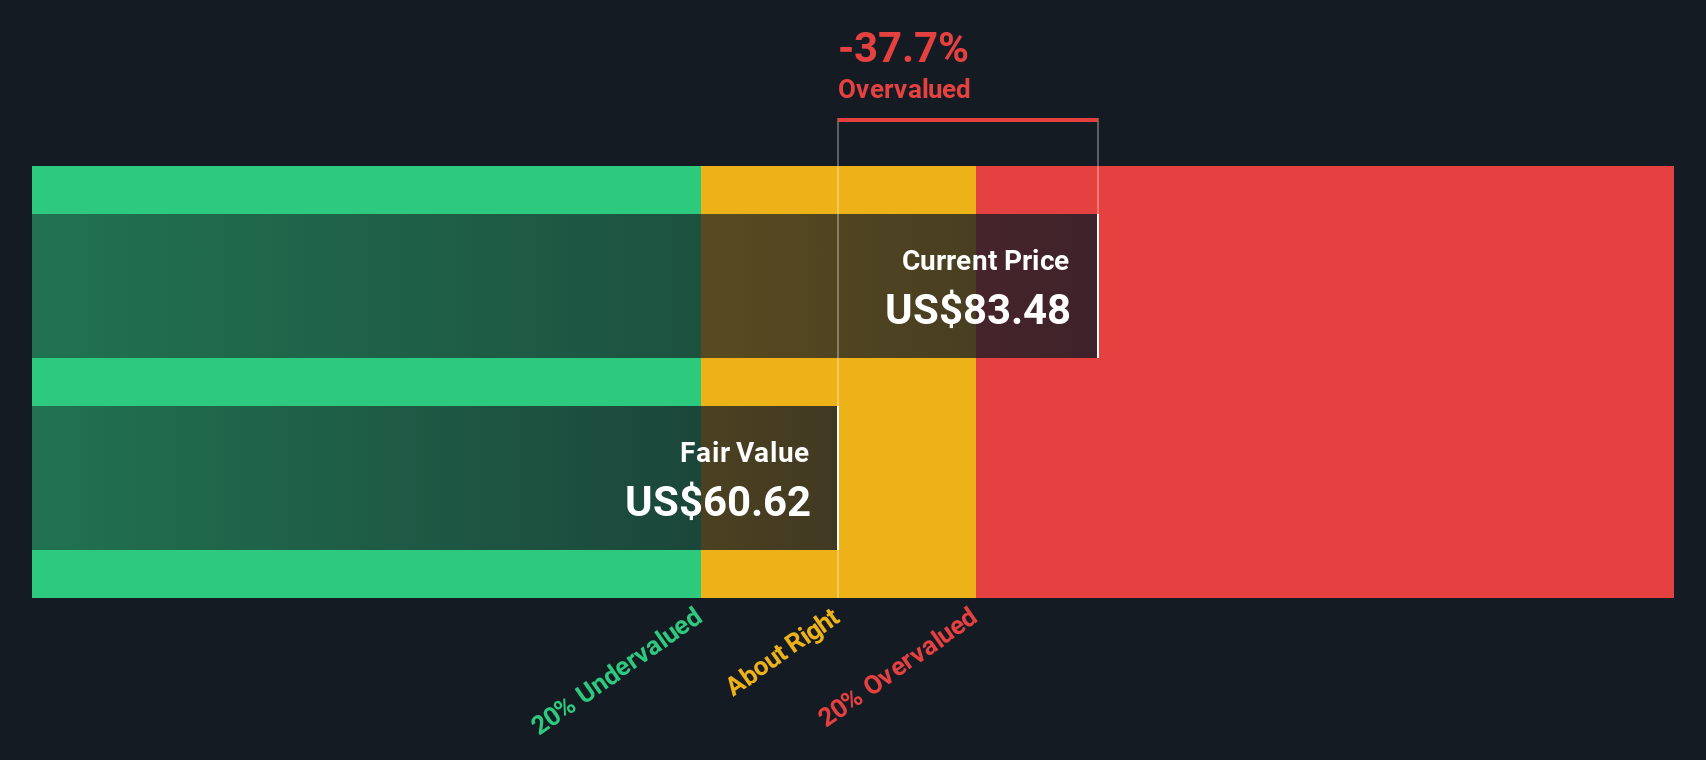
While the 22.1x P/E makes Qnity Electronics look inexpensive next to peers, our DCF model paints a different picture. With an estimated fair value of US$58.07 compared to the recent US$85.11 price, the shares screen as overvalued using this cash flow based approach.
This gap suggests the market may already be factoring in stronger cash generation than the SWS DCF model assumes. This raises the question of whether you are paying up for earnings quality and sector exposure or simply stretching too far above intrinsic value.
Look into how the SWS DCF model arrives at its fair value.
Simply Wall St performs a discounted cash flow (DCF) on every stock in the world every day (check out Qnity Electronics for example). We show the entire calculation in full. You can track the result in your watchlist or portfolio and be alerted when this changes, or use our stock screener to discover 878 undervalued stocks based on their cash flows. If you save a screener we even alert you when new companies match - so you never miss a potential opportunity.
Build Your Own Qnity Electronics Narrative
If you see the numbers differently or prefer to piece together your own view from the data, you can build a custom thesis in minutes, starting with Do it your way.
A good starting point is our analysis highlighting 4 key rewards investors are optimistic about regarding Qnity Electronics.
Looking for more investment ideas?
If you are weighing up Qnity Electronics, this is the moment to broaden your watchlist with a few focused stock ideas that match different priorities.
- Spot potential value opportunities early by checking out these 878 undervalued stocks based on cash flows, which is built around cash flow focused metrics that many investors may be overlooking.
- Target future facing themes by scanning these 25 AI penny stocks, where companies are applying artificial intelligence across software, hardware, and real world use cases.
- Strengthen your income stream by reviewing these 14 dividend stocks with yields > 3%, which combines higher yields with underlying business fundamentals.
This article by Simply Wall St is general in nature. We provide commentary based on historical data and analyst forecasts only using an unbiased methodology and our articles are not intended to be financial advice. It does not constitute a recommendation to buy or sell any stock, and does not take account of your objectives, or your financial situation. We aim to bring you long-term focused analysis driven by fundamental data. Note that our analysis may not factor in the latest price-sensitive company announcements or qualitative material. Simply Wall St has no position in any stocks mentioned.
Have feedback on this article? Concerned about the content? Get in touch with us directly. Alternatively, email editorial-team@simplywallst.com