
 Nasdaq
 華爾街日報
華爾街日報Assessing ISS (CPSE:ISS) Valuation After Launch Of DKK 3,000 Million Share Buyback Programme
ISS (CPSE:ISS) has launched a new share buyback programme of up to DKK 3,000 million over 12 months, drawing attention to how the facility services group is handling excess cash and its share capital structure.
See our latest analysis for ISS.
At a share price of DKK 220.6, ISS has logged an 11.30% 90 day share price return, while its 1 year total shareholder return of 68.80% points to strong momentum that this buyback announcement may be reinforcing rather than reversing.
If this kind of capital return story has caught your attention, it could be a good moment to broaden your search with fast growing stocks with high insider ownership.
With ISS trading at DKK 220.6, sitting close to its DKK 214 analyst price target yet flagged with an estimated 43% intrinsic discount, you have to ask: is this a genuine mispricing, or is the market already factoring in expectations about future growth?
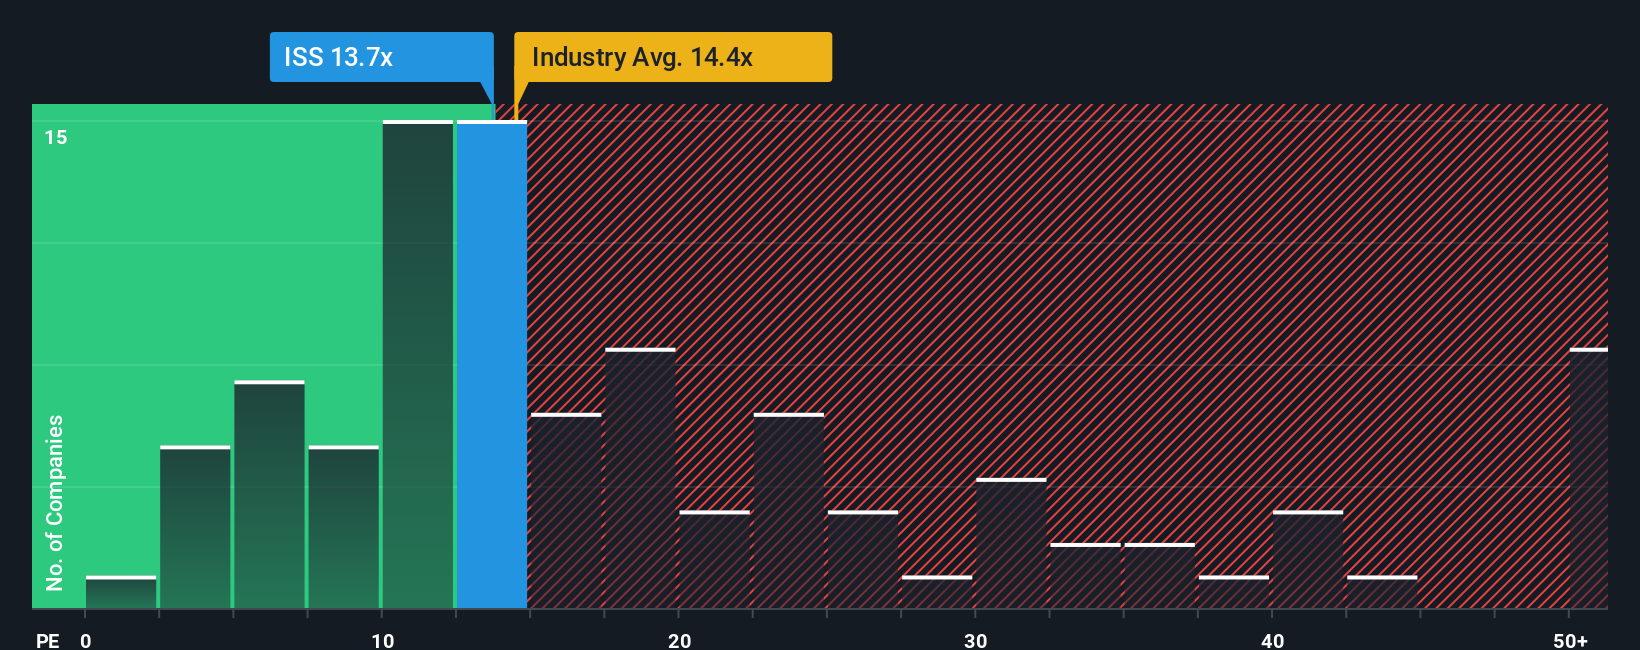
Price-to-Earnings of 13.1x: Is it justified?
ISS is trading on a P/E of 13.1x at a last close of DKK 220.6, which screens as inexpensive compared with both peers and the wider European commercial services group.
The P/E multiple links the current share price to earnings per share, so for a services company like ISS it is a quick way to see what investors are paying for each unit of profit today.
Here, the 13.1x P/E is described as good value relative to a peer average of 25.2x and a European commercial services industry average of 14.3x. This suggests the market is attaching a lower price tag to ISS’s earnings than to those of comparable companies despite its profitable status and recent earnings growth.
That gap to both peer and industry averages is clear, with ISS’s P/E sitting meaningfully below 25.2x for peers and below the 14.3x industry figure. This implies investors currently pay less for ISS’s earnings profile than for many rivals.
See what the numbers say about this price — find out in our valuation breakdown.
Result: Price-to-Earnings of 13.1x (UNDERVALUED)
DCF fair value of DKK 388.66: what does it imply?
Our DCF model estimates a fair value of DKK 388.66 for ISS, compared with the current price of DKK 220.6, which points to a wide valuation gap in cash flow terms.
The SWS DCF model projects ISS’s future cash flows and then discounts them back to today using a required rate of return, so the output reflects what those future cash streams might be worth in present value terms.
For a mature facilities and workplace management group with positive earnings, forecast profit growth of 6.7% per year and high forecast return on equity of 28.7%, this kind of cash flow based approach ties directly to how consistently ISS can convert its global contract base into cash over time.
Look into how the SWS DCF model arrives at its fair value.
Result: DCF Fair value of DKK 388.66 (UNDERVALUED)
However, you still need to watch for risks such as slower revenue growth at 3.3% and any shift in sentiment around that estimated 43% intrinsic discount.
Find out about the key risks to this ISS narrative.
Another angle on ISS’s value
The P/E of 13.1x already screens as inexpensive next to peers at 25.2x and the European commercial services average of 14.3x. This means the market is attaching a clear discount to ISS’s earnings. The real question for you is whether that discount reflects caution or an opportunity the market has not yet closed.
See what the numbers say about this price — find out in our valuation breakdown.
Simply Wall St performs a discounted cash flow (DCF) on every stock in the world every day (check out ISS for example). We show the entire calculation in full. You can track the result in your watchlist or portfolio and be alerted when this changes, or use our stock screener to discover 877 undervalued stocks based on their cash flows. If you save a screener we even alert you when new companies match - so you never miss a potential opportunity.
Build Your Own ISS Narrative
If you see the numbers differently or prefer to piece the story together yourself, you can build a custom view in just a few minutes: Do it your way.
A great starting point for your ISS research is our analysis highlighting 3 key rewards and 1 important warning sign that could impact your investment decision.
Looking for more investment ideas?
If ISS has sharpened your thinking, do not stop here. Widening your opportunity set now can help you spot setups you might otherwise miss.
- Target higher income potential by scanning for companies in these 14 dividend stocks with yields > 3% that may align with your yield goals and cash flow preferences.
- Explore major technology shifts by checking out these 25 AI penny stocks focused on businesses tied to artificial intelligence themes.
- Look for price gaps by reviewing these 877 undervalued stocks based on cash flows to see which companies currently trade below their estimated cash flow value.
This article by Simply Wall St is general in nature. We provide commentary based on historical data and analyst forecasts only using an unbiased methodology and our articles are not intended to be financial advice. It does not constitute a recommendation to buy or sell any stock, and does not take account of your objectives, or your financial situation. We aim to bring you long-term focused analysis driven by fundamental data. Note that our analysis may not factor in the latest price-sensitive company announcements or qualitative material. Simply Wall St has no position in any stocks mentioned.
Have feedback on this article? Concerned about the content? Get in touch with us directly. Alternatively, email editorial-team@simplywallst.com