
 Nasdaq
 華爾街日報
華爾街日報Is Bristol Myers Squibb (BMY) Pricing Reflect Pipeline Progress And DCF Valuation Gap
- If you are wondering whether Bristol-Myers Squibb's current share price really reflects what the company is worth, you are not alone. This article will walk through what the numbers are actually saying about value.
- The stock recently closed at US$53.46, with returns of a 1.2% decline over 7 days, a 2.5% gain over 30 days, flat performance year to date, a 0.9% decline over 1 year and a 13.7% decline over 3 years, while the 5 year return sits around 0.3%.
- Recent headlines around Bristol-Myers Squibb have focused on its pipeline progress and portfolio decisions, which help frame how investors think about future cash flows and risk. These developments provide useful context for why the share price has been moving even without major changes in broad market sentiment.
- On our checklist of 6 valuation tests, Bristol-Myers Squibb scores 5 out of 6. Next we will look at how different valuation approaches arrive at that result, before finishing with a way to think about value that can tie all of these methods together.
Find out why Bristol-Myers Squibb's -0.9% return over the last year is lagging behind its peers.
Approach 1: Bristol-Myers Squibb Discounted Cash Flow (DCF) Analysis
A Discounted Cash Flow model takes estimates of a company’s future cash flows and discounts them back to today using a required rate of return, aiming to express what those future dollars are worth in today’s terms.
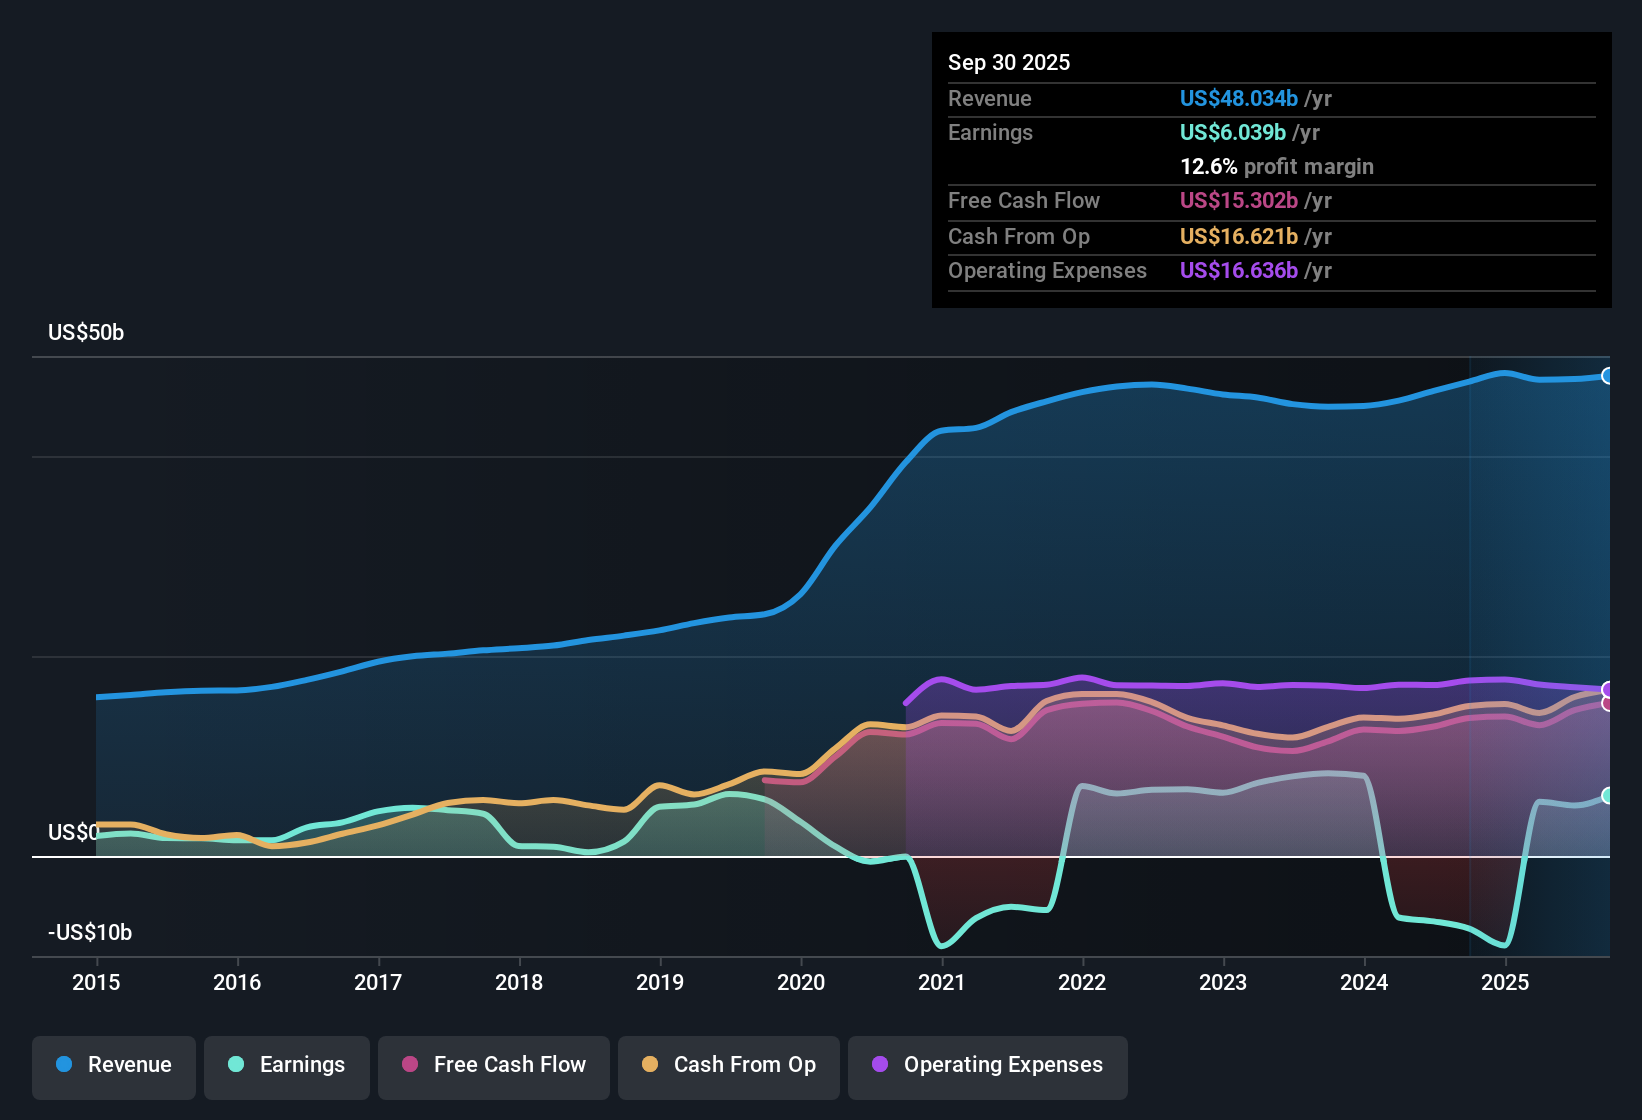
For Bristol-Myers Squibb, the model used is a 2 Stage Free Cash Flow to Equity approach based on cash flow projections. The most recent last twelve months free cash flow sits at about $15.34b. Analysts have supplied several years of free cash flow estimates, and Simply Wall St then extends these out to 10 years. For example, projected free cash flow in 2030 is $11.19b, with intermediate years such as 2026 and 2027 at $13.73b and $13.31b respectively, followed by extrapolated values through 2035.
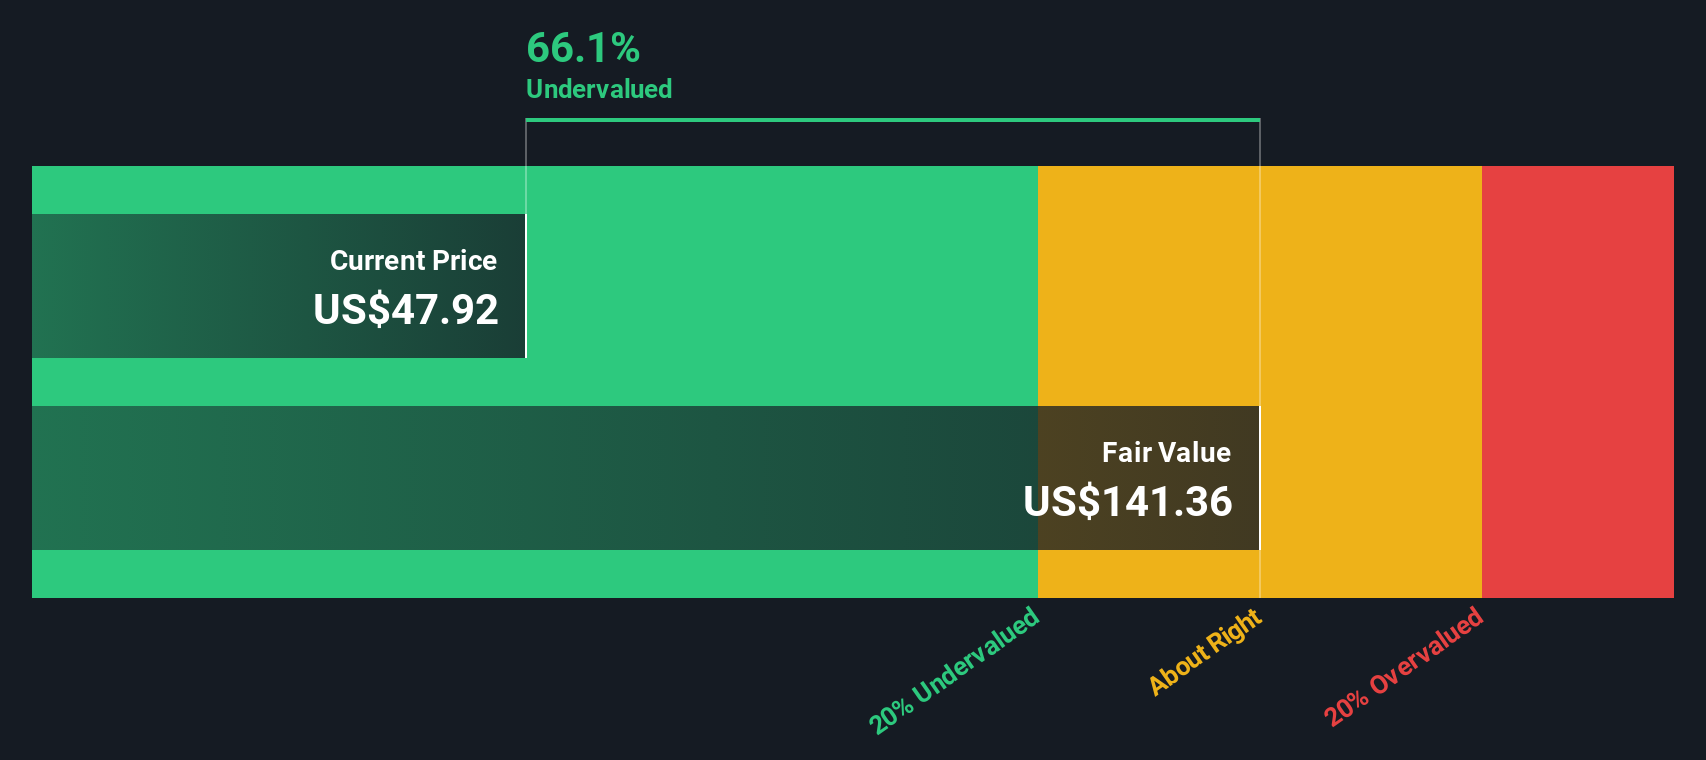
When these forecast cash flows are discounted back and aggregated, the model arrives at an estimated intrinsic value of about $127.94 per share. Compared to the recent share price of $53.46, this implies a discount of roughly 58.2%, which indicates the stock is trading well below this DCF estimate.
Result: UNDERVALUED
Our Discounted Cash Flow (DCF) analysis suggests Bristol-Myers Squibb is undervalued by 58.2%. Track this in your watchlist or portfolio, or discover 876 more undervalued stocks based on cash flows.
Approach 2: Bristol-Myers Squibb Price vs Earnings
For a profitable company like Bristol-Myers Squibb, the P/E ratio is a useful way to gauge what investors are currently willing to pay for each dollar of earnings. It gives you a quick link between the share price and the underlying profit the business is generating.
What counts as a “normal” or “fair” P/E depends on how the market views a company’s earnings growth potential and risk profile. Higher expected growth or lower perceived risk can support a higher P/E, while slower growth or higher risk tends to justify a lower one.
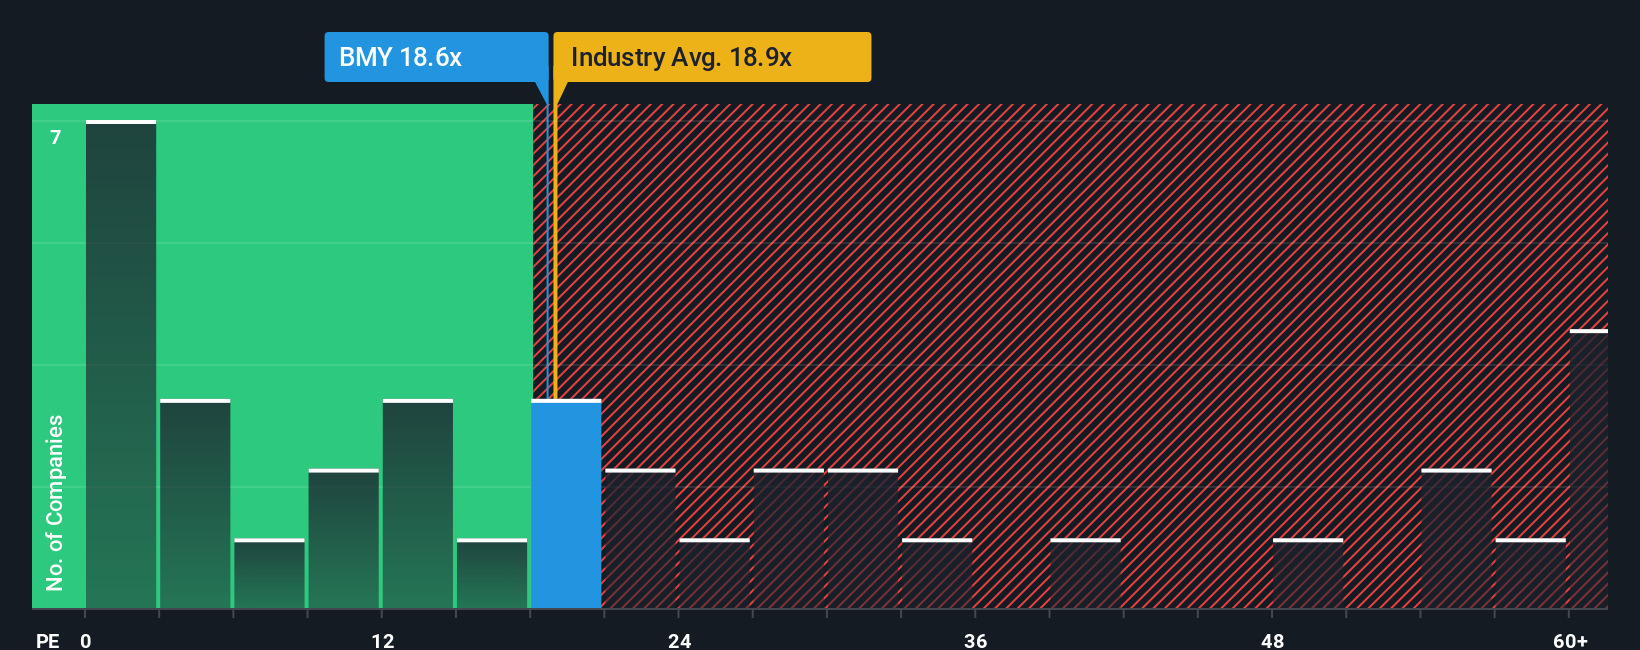
Bristol-Myers Squibb currently trades on a P/E of 18.02x. That sits below the Pharmaceuticals industry average of 19.89x and also below the peer group average of 24.81x. Simply Wall St’s Fair Ratio for Bristol-Myers Squibb is 23.90x, which is its proprietary view of what the P/E could be given factors such as earnings growth characteristics, profit margins, industry, market cap and company specific risks. This Fair Ratio can be more tailored than a simple comparison with peers or the broad industry because it adjusts for company level traits rather than assuming all firms deserve the same multiple. Comparing 18.02x to the 23.90x Fair Ratio suggests the shares trade below this Fair Ratio based view.
Result: UNDERVALUED
P/E ratios tell one story, but what if the real opportunity lies elsewhere? Discover 1460 companies where insiders are betting big on explosive growth.
Upgrade Your Decision Making: Choose your Bristol-Myers Squibb Narrative
Earlier we mentioned that there is an even better way to think about value. Let us introduce Narratives, which let you attach a clear story about Bristol-Myers Squibb to the numbers you care about, such as fair value estimates and expectations for future revenue, earnings and margins. You can then connect that story to a forecast and finally to a fair value that you can compare with the current price to help decide whether the stock looks interesting or expensive at any point in time.
On Simply Wall St’s Community page, Narratives are an easy tool used by millions of investors. They update automatically when new information like earnings, product approvals or guidance is released, so your fair value view stays aligned with the latest data rather than a static one off model.
For example, one Bristol-Myers Squibb Narrative on the platform currently has a fair value of US$65.00 per share based on 7% revenue growth in 2024, cost saving plans and a discount rate of 6.21%. Another has a fair value of about US$53.55 using a 6.96% discount rate, different revenue and margin assumptions and a 15.18x future P/E. This shows how two investors can look at the same company, apply different stories and arrive at very different but clearly explained fair values.
Do you think there's more to the story for Bristol-Myers Squibb? Head over to our Community to see what others are saying!
This article by Simply Wall St is general in nature. We provide commentary based on historical data and analyst forecasts only using an unbiased methodology and our articles are not intended to be financial advice. It does not constitute a recommendation to buy or sell any stock, and does not take account of your objectives, or your financial situation. We aim to bring you long-term focused analysis driven by fundamental data. Note that our analysis may not factor in the latest price-sensitive company announcements or qualitative material. Simply Wall St has no position in any stocks mentioned.
Have feedback on this article? Concerned about the content? Get in touch with us directly. Alternatively, email editorial-team@simplywallst.com