
 Nasdaq
 華爾街日報
華爾街日報Assessing Morningstar (MORN) Valuation After Recent Share Price Weakness And DCF Fair Value Signals
Morningstar (MORN) has drawn investor attention after recent share price weakness, with the stock down about 3% over the past month and 7% in the past 3 months from its last close of $210.42.
See our latest analysis for Morningstar.
That recent 1 month share price return of 3.57% and 3 month share price return of 7% sit against a 1 year total shareholder return of 34.79% and 5 year total shareholder return of 4.11%. This suggests momentum has faded compared with the longer run.
If this pullback has you rethinking your watchlist, it could be a good moment to broaden your research and check out fast growing stocks with high insider ownership.
With Morningstar producing revenue of $2,395.4m and net income of $376.0m, the recent share price slide and a roughly 32% gap to the average analyst price target raise a key question: is this a buying opportunity, or is the market already pricing in future growth?
Price to Earnings of 23x: Is it justified?
Morningstar is trading on a P/E of 23x at the last close of $210.42, which sits below several reference points yet screens as expensive versus one key fair value yardstick.
The P/E multiple compares the share price to earnings per share, so it effectively tells you how much investors are paying today for each dollar of current earnings. For a diversified financials business that earns fees on data, analytics, and related services, this is a common way investors frame expectations for profit strength and durability.
Here, the picture is mixed. On one hand, Morningstar is described as good value relative to the US Capital Markets industry average P/E of 25.6x and a peer average of 27.6x, which suggests the market is not assigning a premium above those groups. On the other hand, compared with an estimated fair P/E of 14.7x and a DCF based fair value of $99.71, the current 23x multiple points to a richer price level that the market could eventually re rate closer to those lower benchmarks.
Against the industry, the current 23x P/E stands clearly below both the 25.6x sector average and the 27.6x peer average. This is a meaningful discount in relative terms, yet still well above the suggested fair P/E of 14.7x that our regression based fair ratio points to as a potential anchor.
Explore the SWS fair ratio for Morningstar
Result: Price to Earnings of 23x (OVERVALUED)
However, you also have to weigh risks such as a potential de rating toward the 14.7x fair P/E and any shift in sentiment around analyst price targets.
Find out about the key risks to this Morningstar narrative.
Another View: Our DCF Model Points the Other Way
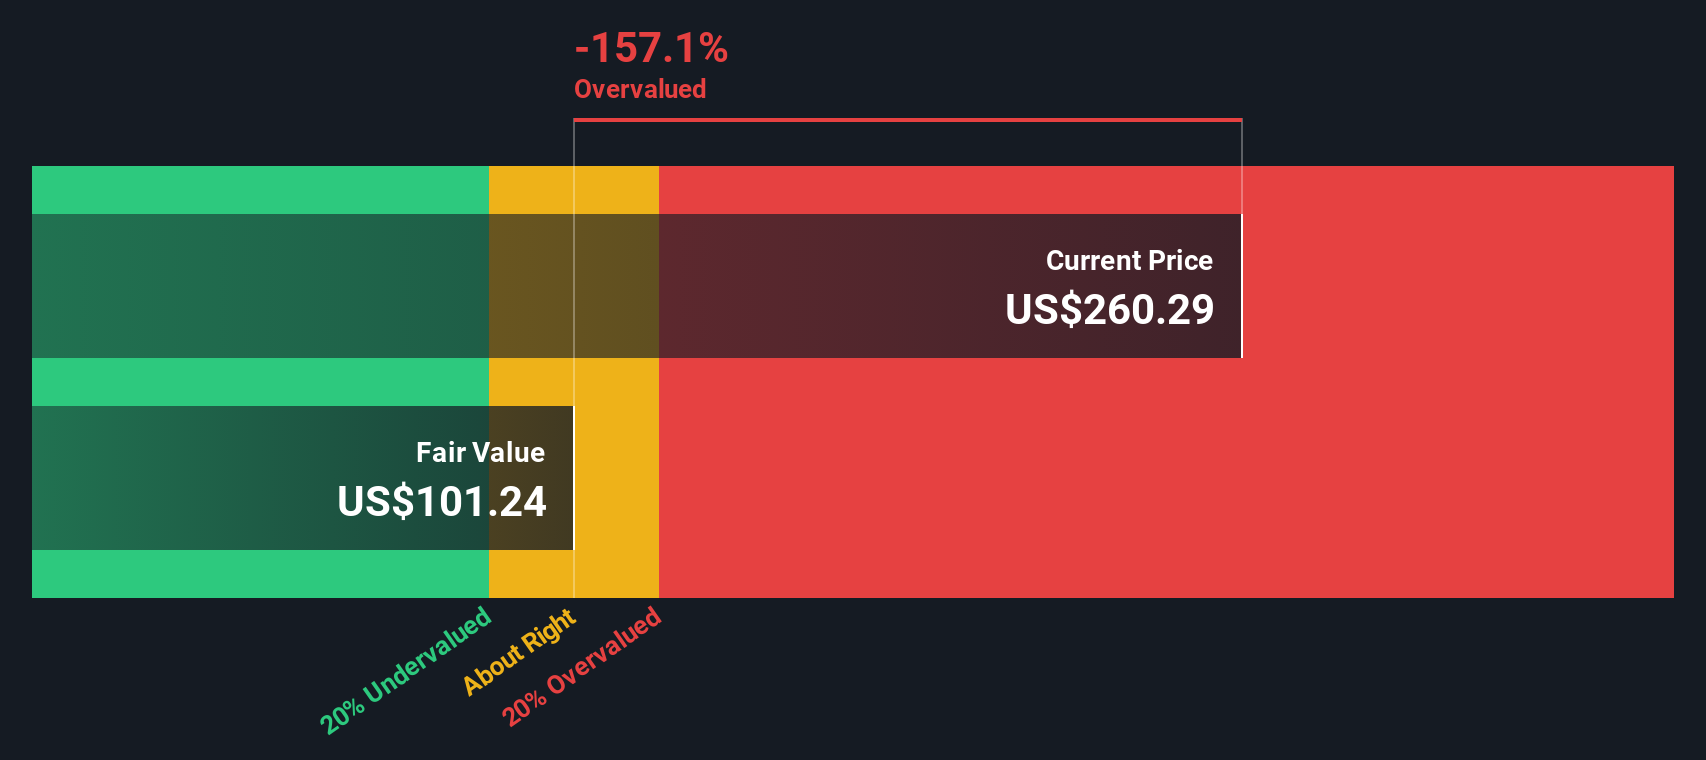
While the 23x P/E hints at a richer price than the fair ratio of 14.7x, our DCF model goes further and indicates overvaluation, with an estimated fair value of US$99.71 compared with the current US$210.42. That is a wide gap, so which signal do you treat as more important?
Look into how the SWS DCF model arrives at its fair value.
Simply Wall St performs a discounted cash flow (DCF) on every stock in the world every day (check out Morningstar for example). We show the entire calculation in full. You can track the result in your watchlist or portfolio and be alerted when this changes, or use our stock screener to discover 878 undervalued stocks based on their cash flows. If you save a screener we even alert you when new companies match - so you never miss a potential opportunity.
Build Your Own Morningstar Narrative
If you see the numbers differently or prefer to work through the data yourself, you can build a tailored view in just a few minutes with Do it your way.
A good starting point is our analysis highlighting 4 key rewards investors are optimistic about regarding Morningstar.
Looking for more investment ideas?
If Morningstar is already on your radar, do not stop there. Use the same structured approach to spot other opportunities that suit your style and risk comfort.
- Target reliable income streams by zeroing in on these 14 dividend stocks with yields > 3% that could complement a long term, cash flow focused portfolio.
- Spot potential mispricings by scanning these 878 undervalued stocks based on cash flows for businesses where market expectations and underlying cash flows look out of sync.
- Get ahead of thematic shifts by reviewing these 79 cryptocurrency and blockchain stocks that are tied to blockchain, digital payments, and related infrastructure.
This article by Simply Wall St is general in nature. We provide commentary based on historical data and analyst forecasts only using an unbiased methodology and our articles are not intended to be financial advice. It does not constitute a recommendation to buy or sell any stock, and does not take account of your objectives, or your financial situation. We aim to bring you long-term focused analysis driven by fundamental data. Note that our analysis may not factor in the latest price-sensitive company announcements or qualitative material. Simply Wall St has no position in any stocks mentioned.
Have feedback on this article? Concerned about the content? Get in touch with us directly. Alternatively, email editorial-team@simplywallst.com