
 Nasdaq
 華爾街日報
華爾街日報Has Garmin (GRMN) Fallen Enough After Flat Year To Look Attractive Again?
- If you are wondering whether Garmin's current share price lines up with its underlying worth, this article is designed to walk you through the pieces that matter most.
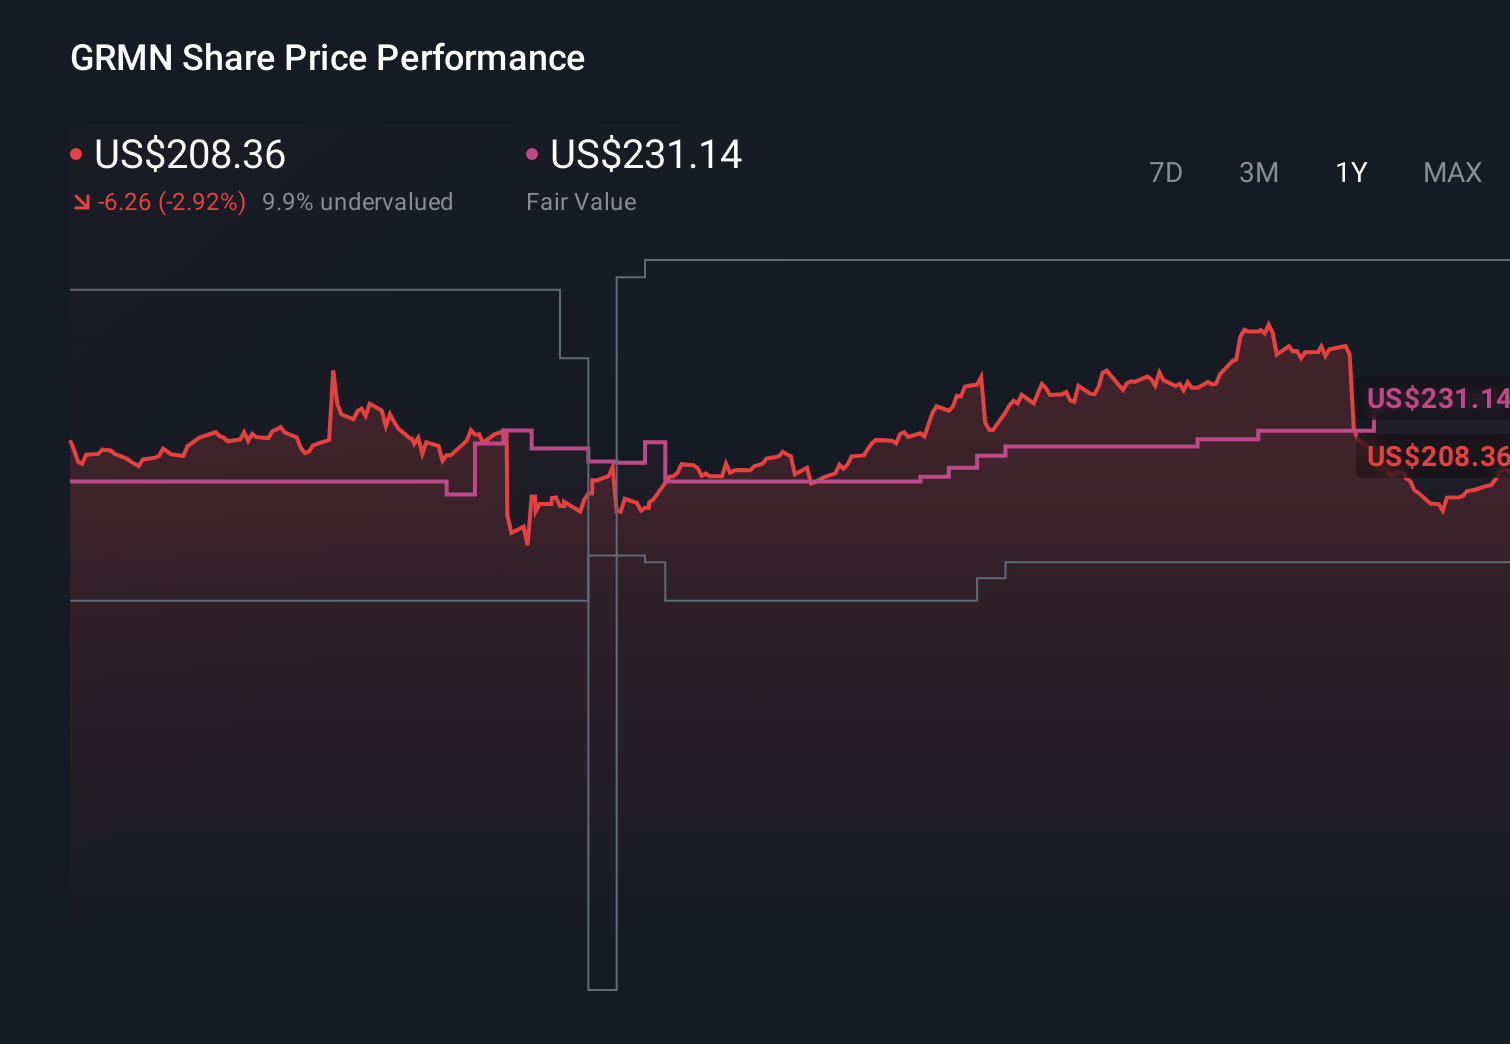
- Garmin's share price closed at US$202.44, with a 1.5% decline over the last 7 days, a 0.6% decline over the last 30 days, and a 1% decline over the last year. The 3 year and 5 year returns are 118.9% and 86.1% respectively, and the year to date return sits at 0.0%.
- Those moves have put valuation questions back on the radar for many investors, who are weighing recent performance against Garmin's long term track record. In this article we will set that short term price action alongside more structured valuation checks.
- On Simply Wall St's 6 point valuation checklist Garmin scores 2 out of 6. Next we will walk through what different valuation approaches suggest about the stock, before finishing with a way to pull these methods together into a clearer picture.
Garmin scores just 2/6 on our valuation checks. See what other red flags we found in the full valuation breakdown.
Approach 1: Garmin Discounted Cash Flow (DCF) Analysis
A Discounted Cash Flow model takes estimates of the cash a company might generate in the future and discounts those figures back to today, aiming to translate long term cash flows into a single present value per share.
For Garmin, the model uses last twelve months Free Cash Flow of about $1.33b and a 2 Stage Free Cash Flow to Equity framework. Analyst inputs cover the next few years, then Simply Wall St extrapolates further, with projected Free Cash Flow of $2.45b in 2030 based on the schedule of ten year projections shown in the model output.
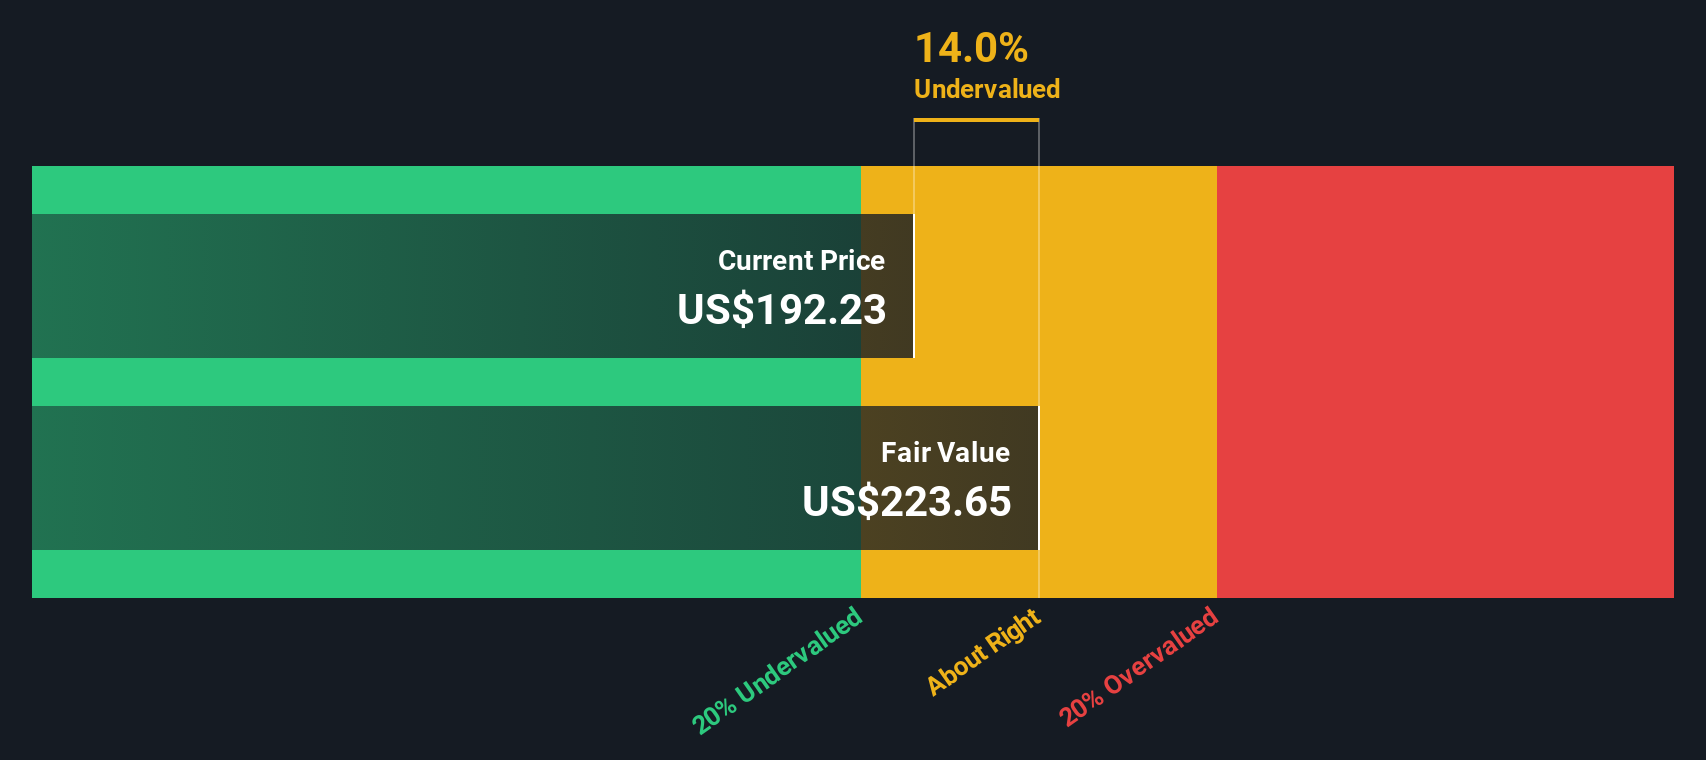
When all those future cash flows are discounted back using this approach, the estimated intrinsic value is about $262.01 per share. Compared with the recent share price of US$202.44, the model implies Garmin is trading at roughly a 22.7% discount to this DCF estimate, which suggests the stock may be undervalued on these assumptions.
Result: UNDERVALUED
Our Discounted Cash Flow (DCF) analysis suggests Garmin is undervalued by 22.7%. Track this in your watchlist or portfolio, or discover 878 more undervalued stocks based on cash flows.
Approach 2: Garmin Price vs Earnings
For a profitable company like Garmin, the P/E ratio is a useful way to relate what you pay for each share to the earnings the business is currently generating. In general, higher growth expectations and lower perceived risk tend to support a higher P/E, while lower growth or higher risk usually point to a lower, more conservative P/E range.
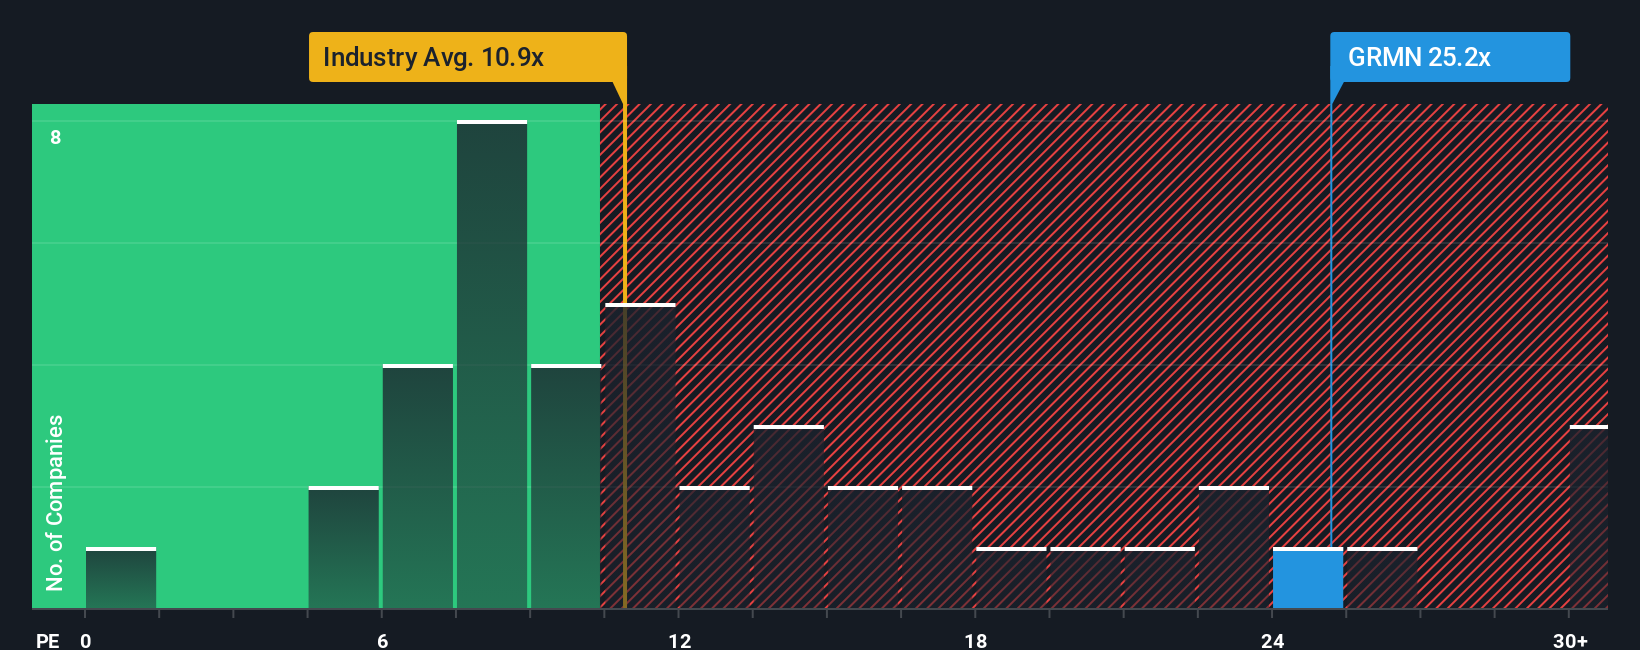
Garmin currently trades on a P/E of 24.79x. That is above the Consumer Durables industry average P/E of 10.47x and also above the peer group average of 23.04x. Simply Wall St’s Fair Ratio for Garmin, which blends factors such as earnings growth, industry, profit margin, market cap and risk into one preferred multiple, is 19.91x.
The Fair Ratio aims to be more tailored than a simple peer or industry comparison, because it adjusts for Garmin’s specific profile rather than assuming all companies in the sector deserve similar multiples. Comparing Garmin’s current P/E of 24.79x with the Fair Ratio of 19.91x indicates that the shares are pricing in more than this model would typically imply.
Result: OVERVALUED
P/E ratios tell one story, but what if the real opportunity lies elsewhere? Discover 1460 companies where insiders are betting big on explosive growth.
Upgrade Your Decision Making: Choose your Garmin Narrative
Earlier we mentioned that there is an even better way to understand valuation. On Simply Wall St’s Community page you can use Narratives to turn your view of Garmin into a simple story that links assumptions about future revenue, earnings and margins to a forecast and fair value. It then compares that fair value with the current share price to frame potential buy or sell decisions, and keeps that view updated automatically as new news or earnings arrive. For example, one investor might build a bullish Garmin Narrative around premium wearables, aviation wins and a fair value closer to the higher analyst target of about US$300, while another might focus on concerns in Marine and Outdoor and anchor their Narrative near the lower target around US$190.
Do you think there's more to the story for Garmin? Head over to our Community to see what others are saying!
This article by Simply Wall St is general in nature. We provide commentary based on historical data and analyst forecasts only using an unbiased methodology and our articles are not intended to be financial advice. It does not constitute a recommendation to buy or sell any stock, and does not take account of your objectives, or your financial situation. We aim to bring you long-term focused analysis driven by fundamental data. Note that our analysis may not factor in the latest price-sensitive company announcements or qualitative material. Simply Wall St has no position in any stocks mentioned.
Have feedback on this article? Concerned about the content? Get in touch with us directly. Alternatively, email editorial-team@simplywallst.com