
 Nasdaq
 華爾街日報
華爾街日報Is MetLife (MET) Pricing Reflect Its Earnings Power And Excess Returns Today
- If you are wondering whether MetLife is priced fairly today or if there is still value on the table, you are in the right place.
- MetLife recently closed at US$80.32, with returns of 0.4% over 7 days, 2.1% over 30 days, 0.0% year to date, 0.8% over 1 year, 23.5% over 3 years and 89.7% over 5 years. This gives useful context before lining that price up against its fundamentals.
- Recent coverage has focused on MetLife's position as a major US insurer and how it fits into broader discussions about financial stocks. There has been particular attention on how interest rate trends and capital returns often influence investor sentiment in this sector. These themes help frame how investors may be thinking about the current share price and the balance between income, growth potential and risk.
- On our checks, MetLife scores 3 out of 6 on valuation, giving it a 3/6 value score. Next we will look at how different valuation methods line up on this stock before finishing with a more complete way to think about what that score really means.
Find out why MetLife's 0.8% return over the last year is lagging behind its peers.
Approach 1: MetLife Excess Returns Analysis
The Excess Returns model looks at how much profit a company can generate above its cost of equity, based on its book value and expected returns on that equity. Instead of focusing on cash flows, it centers on whether each dollar of shareholder capital is expected to earn more than investors require.
For MetLife, the model uses a Book Value of $43.81 per share and a Stable EPS of $7.88 per share, based on weighted future Return on Equity estimates from 7 analysts. The Average Return on Equity is 16.01%, while the Cost of Equity is $3.42 per share. That leaves an estimated Excess Return of $4.46 per share, indicating that the company is projected to earn more than the required return on its equity base. The Stable Book Value is put at $49.20 per share, based on estimates from 5 analysts.
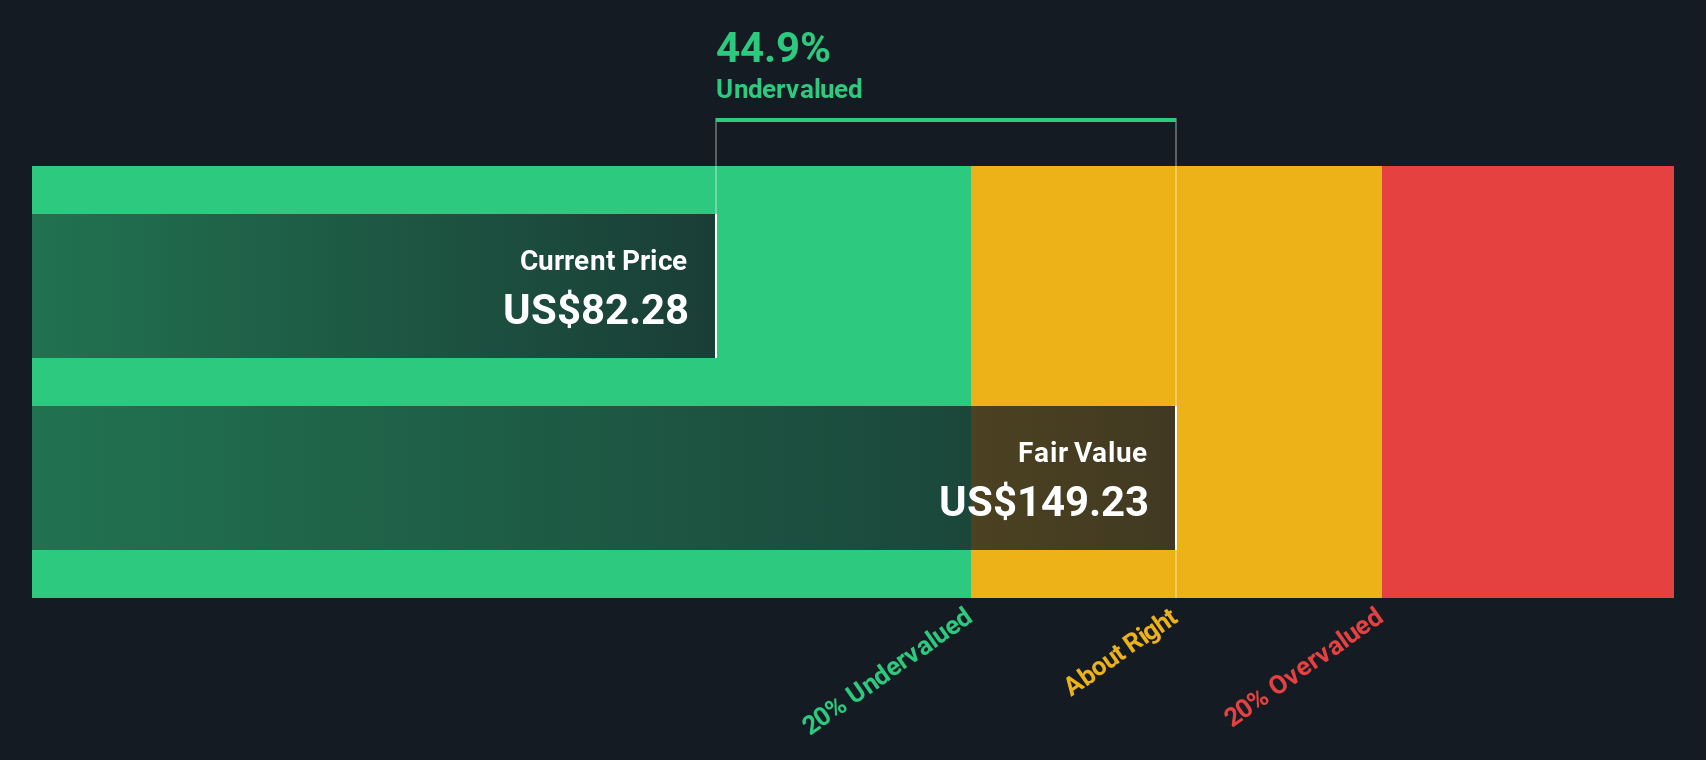
Based on these inputs, the Excess Returns model arrives at an intrinsic value of about $169.77 per share. Compared with the recent share price of $80.32, this implies the stock is 52.7% undervalued on this approach.
Result: UNDERVALUED
Our Excess Returns analysis suggests MetLife is undervalued by 52.7%. Track this in your watchlist or portfolio, or discover 870 more undervalued stocks based on cash flows.
Approach 2: MetLife Price vs Earnings
For a profitable insurer like MetLife, the P/E ratio is a useful way to think about what you are paying for each dollar of earnings. It ties the share price directly to current earnings power, which is usually a key anchor for financial stocks.
What counts as a “normal” P/E depends on how the market views a company’s growth outlook and risk. Higher expected growth or lower perceived risk can justify a higher P/E, while slower growth or higher risk tends to sit at the lower end of the range.
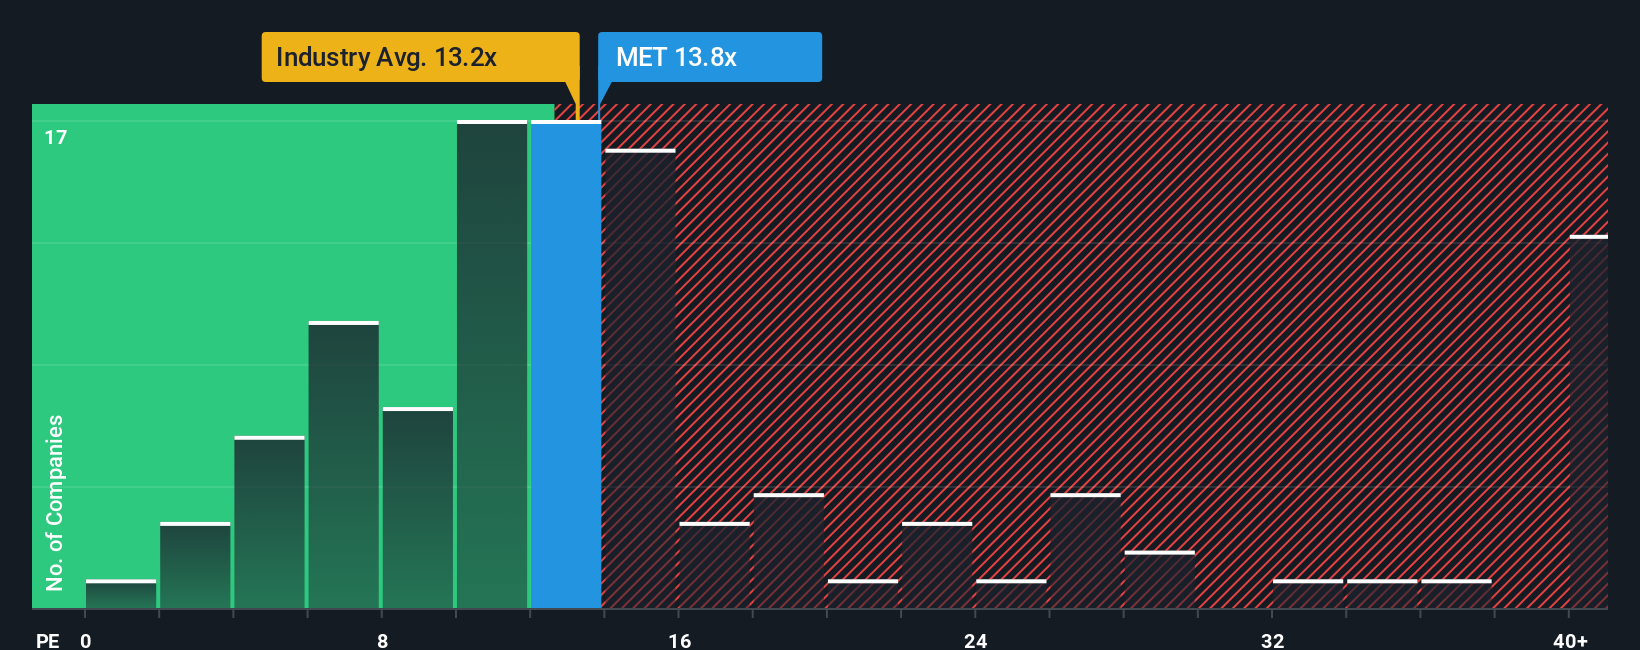
MetLife is trading on a P/E of 14.56x, compared with a peer average of 13.98x and an Insurance industry average of 12.91x. Simply Wall St’s Fair Ratio framework estimates a P/E of 17.54x for MetLife. This Fair Ratio is a proprietary view of what a reasonable P/E could be, given factors such as earnings growth expectations, profit margins, industry, market cap and company specific risks, rather than relying only on broad peer or industry comparisons.
Set against the current P/E of 14.56x, the Fair Ratio of 17.54x suggests the shares are trading below that model based reference point.
Result: UNDERVALUED
P/E ratios tell one story, but what if the real opportunity lies elsewhere? Discover 1462 companies where insiders are betting big on explosive growth.
Upgrade Your Decision Making: Choose your MetLife Narrative
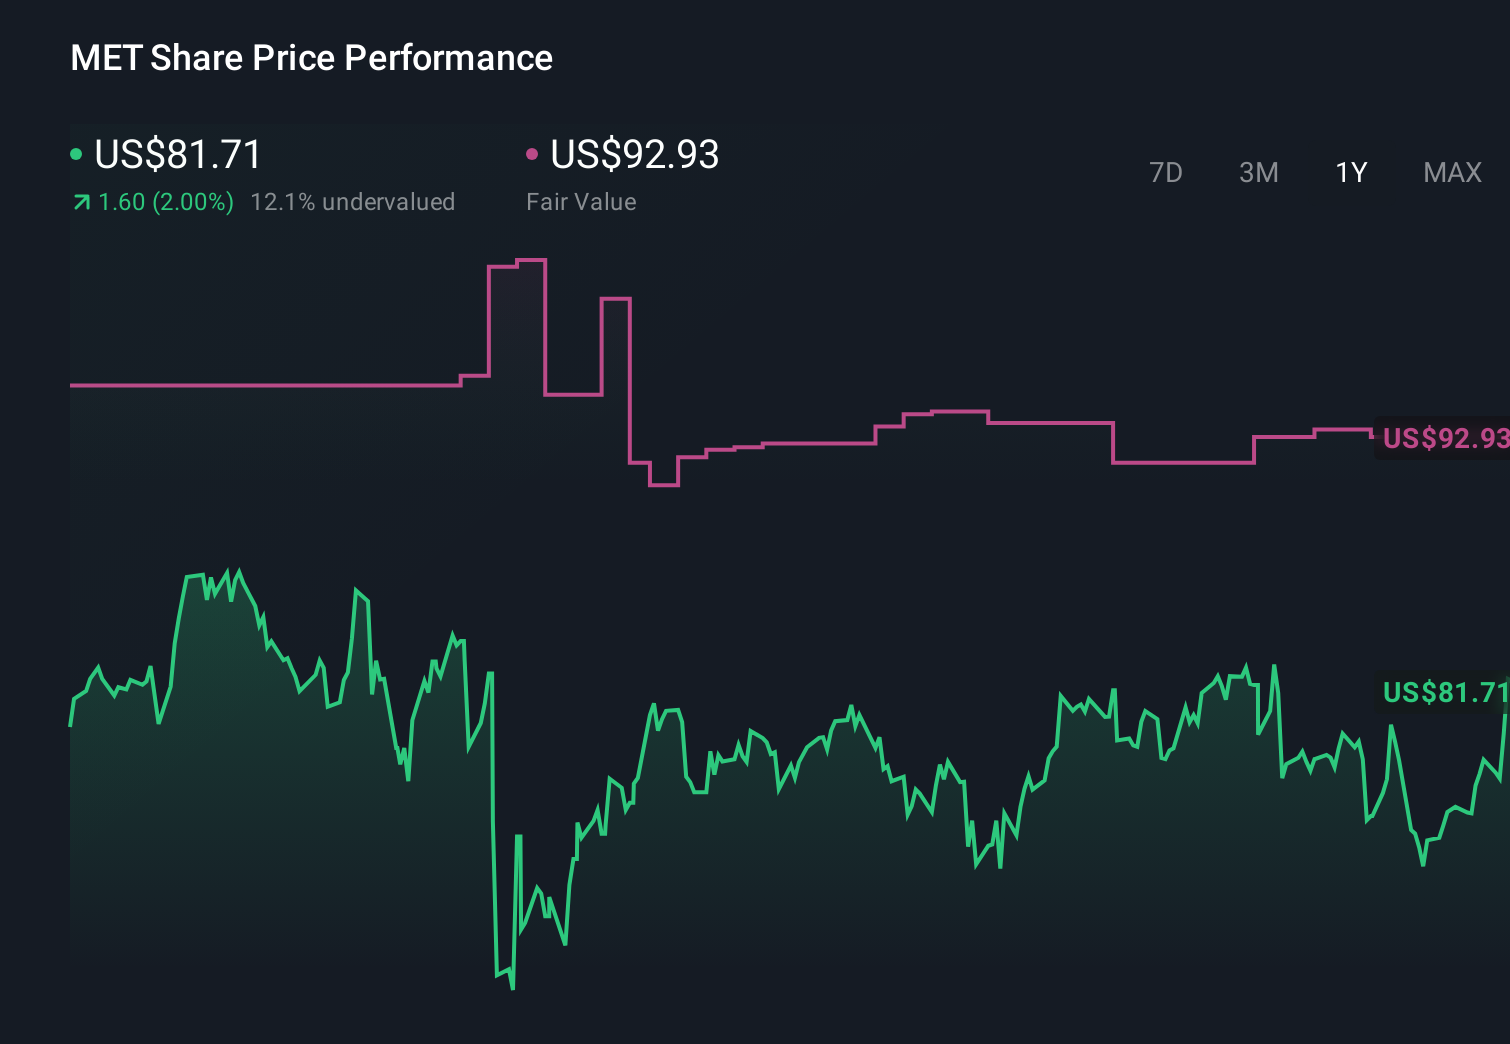
Earlier we mentioned that there is an even better way to understand valuation, so let us introduce you to Narratives. These are simple stories you create about MetLife that connect your view of its future revenue, earnings, margins and fair value to a clear forecast. They sit inside the Community page on Simply Wall St where millions of investors share their views, update automatically when fresh news or earnings data comes in, and help you compare your fair value to the current price to decide whether MetLife looks attractive or not. For example, one investor might build a Narrative that leans into retirement income agreements, international growth, digital transformation and asset light fee businesses, and arrive at a fair value close to the consensus of about US$92.93 per share. A more cautious investor might focus on compressed investment yields, underwriting margin volatility, commercial mortgage loan risks and technology execution, and land nearer the low analyst target of US$72. In both cases, the views are clearly tied to numbers rather than just opinions.
Do you think there's more to the story for MetLife? Head over to our Community to see what others are saying!
This article by Simply Wall St is general in nature. We provide commentary based on historical data and analyst forecasts only using an unbiased methodology and our articles are not intended to be financial advice. It does not constitute a recommendation to buy or sell any stock, and does not take account of your objectives, or your financial situation. We aim to bring you long-term focused analysis driven by fundamental data. Note that our analysis may not factor in the latest price-sensitive company announcements or qualitative material. Simply Wall St has no position in any stocks mentioned.
Have feedback on this article? Concerned about the content? Get in touch with us directly. Alternatively, email editorial-team@simplywallst.com