
 Nasdaq
 華爾街日報
華爾街日報Is It Too Late To Consider Royal Gold (RGLD) After A 68% One Year Surge?
- If you are wondering whether Royal Gold's current share price still makes sense after a strong run, this breakdown will help you see how the market's view lines up with a range of valuation checks.
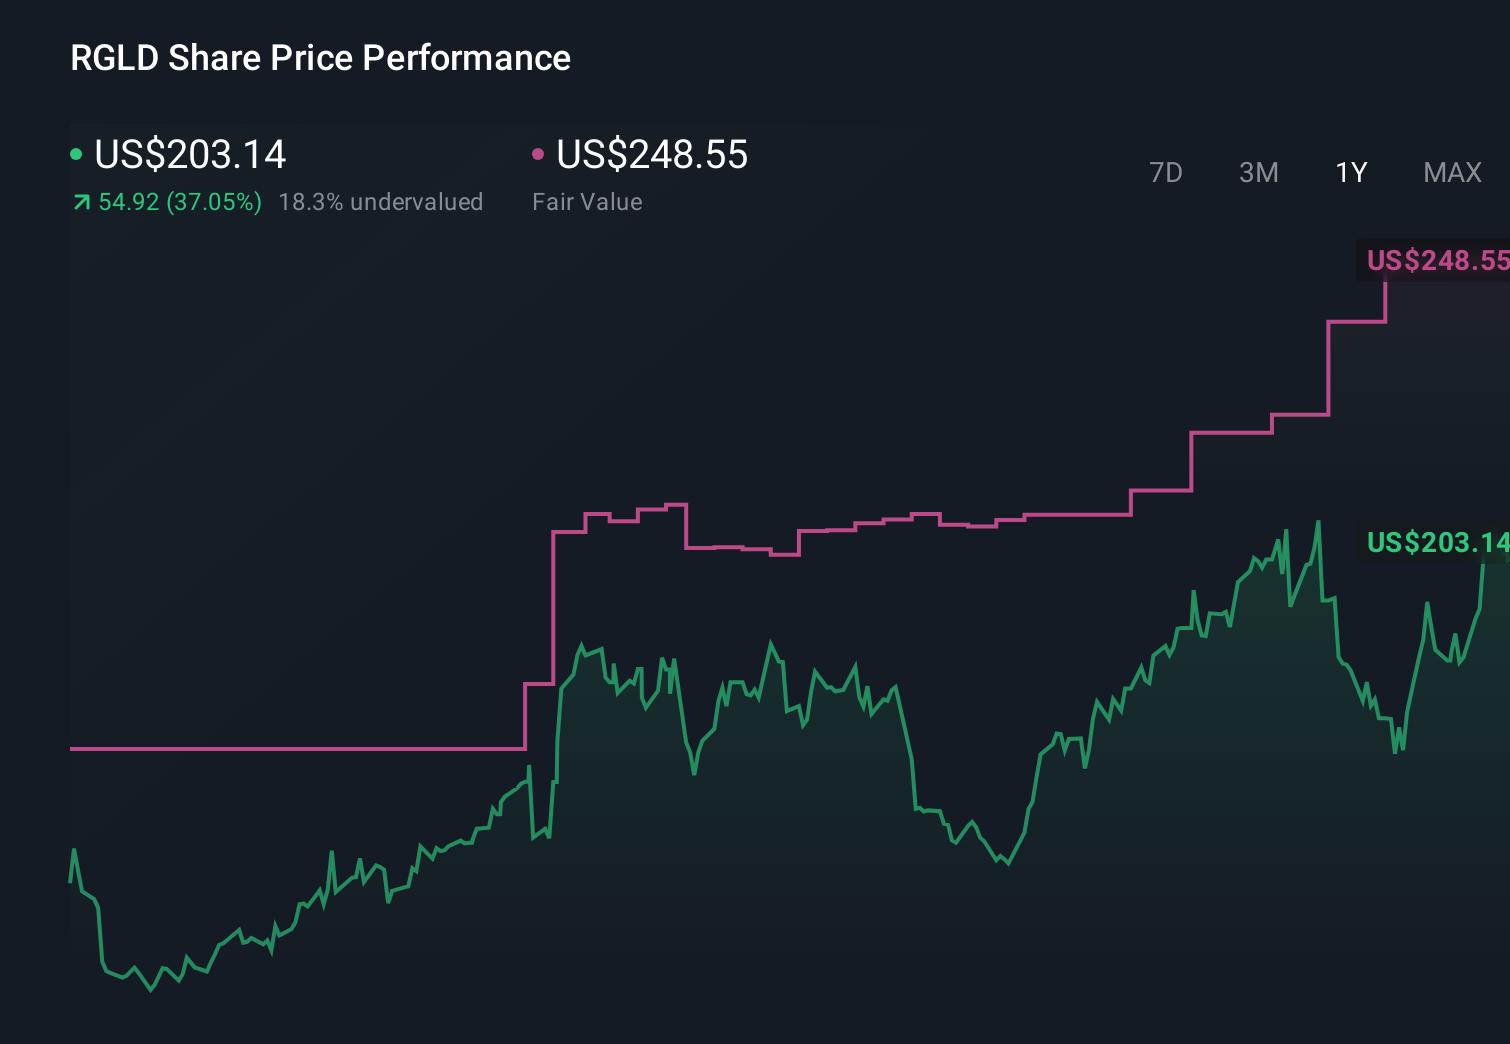
- The stock closed at US$221.12 recently, with a 1.9% decline over the last 7 days, a 9.6% gain over 30 days, and returns of 0.0% year to date, 68.4% over 1 year, 87.1% over 3 years, and 121.3% over 5 years.
- These moves sit against a backdrop of ongoing interest in gold related names and Royal Gold's role as a royalty and streaming company. This type of business can behave differently to traditional miners. Investors watching the stock are weighing how this business model and commodity sentiment may be feeding into recent price action.
- On our valuation checks, Royal Gold currently scores 1 out of 6 for being undervalued. Next we look at how different valuation approaches stack up for the company and then finish with a way to think about value that goes beyond any single model.
Royal Gold scores just 1/6 on our valuation checks. See what other red flags we found in the full valuation breakdown.
Approach 1: Royal Gold Discounted Cash Flow (DCF) Analysis
A Discounted Cash Flow model takes estimates of the cash a business could generate in the future and discounts those back to today, to arrive at an estimate of what the entire company might be worth right now.
For Royal Gold, the model used here is a 2 Stage Free Cash Flow to Equity approach, based on cash flow projections in $. The latest reported free cash flow is $13.09 million. Analysts have provided forecasts that feed into a ten year projection, with Simply Wall St extrapolating beyond the initial analyst horizon. For example, projected free cash flow for 2029 is $1,287 million, with other years in the 2026 to 2035 window also sitting in the hundred million to low billion dollar range.
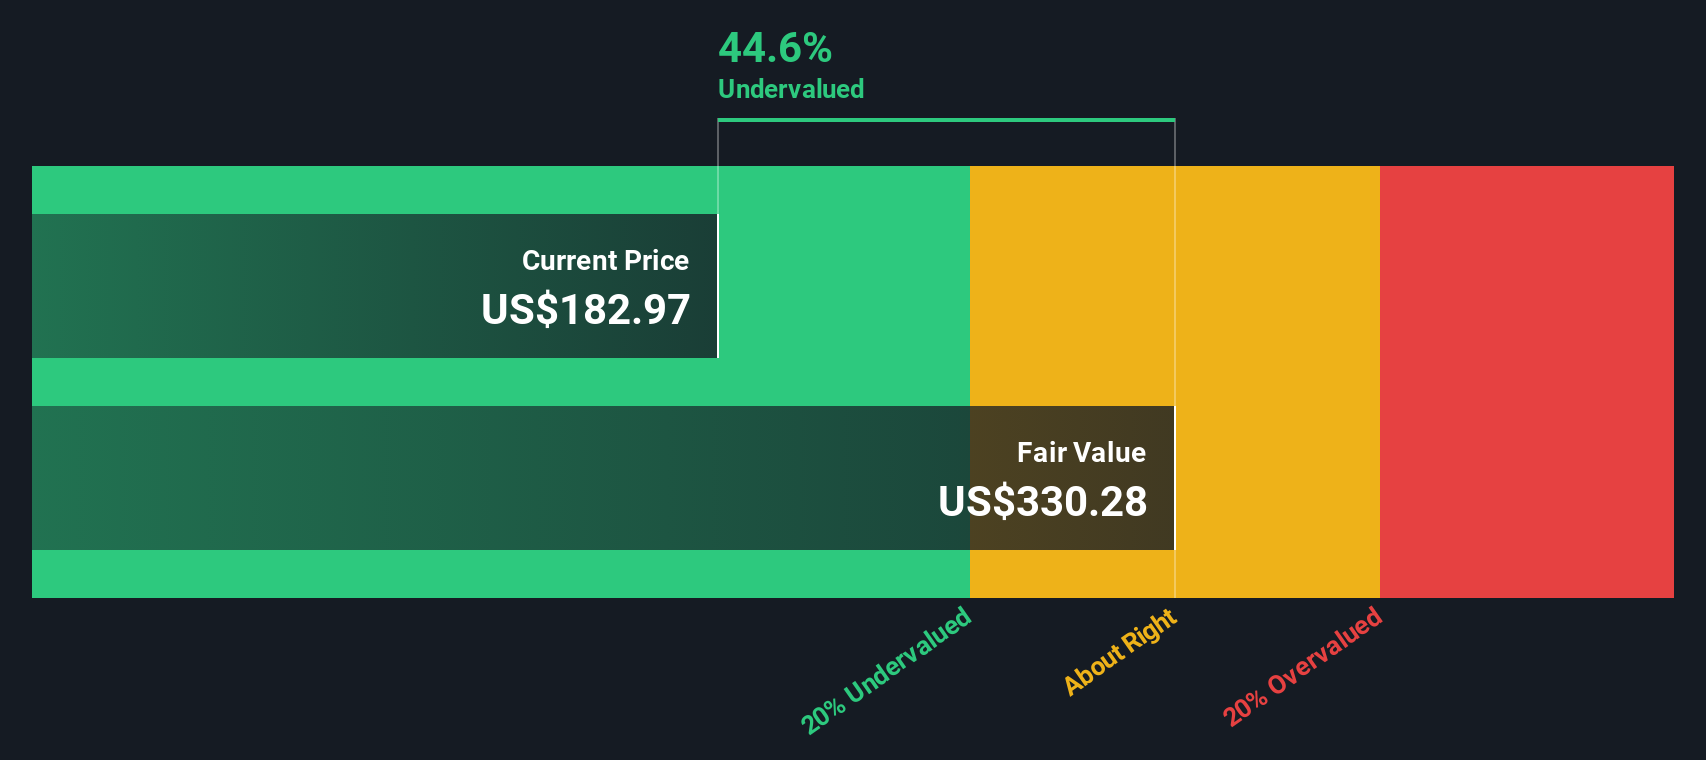
When these projected cash flows are discounted back using the DCF model, the estimated intrinsic value comes out at $268.02 per share. Compared with the recent share price of about $221.12, this implies the shares are trading at a 17.5% discount to that DCF estimate, which indicates that the stock appears undervalued on this specific model.
Result: UNDERVALUED
Our Discounted Cash Flow (DCF) analysis suggests Royal Gold is undervalued by 17.5%. Track this in your watchlist or portfolio, or discover 870 more undervalued stocks based on cash flows.
Approach 2: Royal Gold Price vs Earnings
For a profitable business like Royal Gold, the P/E ratio is a straightforward way to see how much investors are paying for each dollar of earnings. It lets you line the stock up against its own history, its sector and broader market expectations for growth and risk.
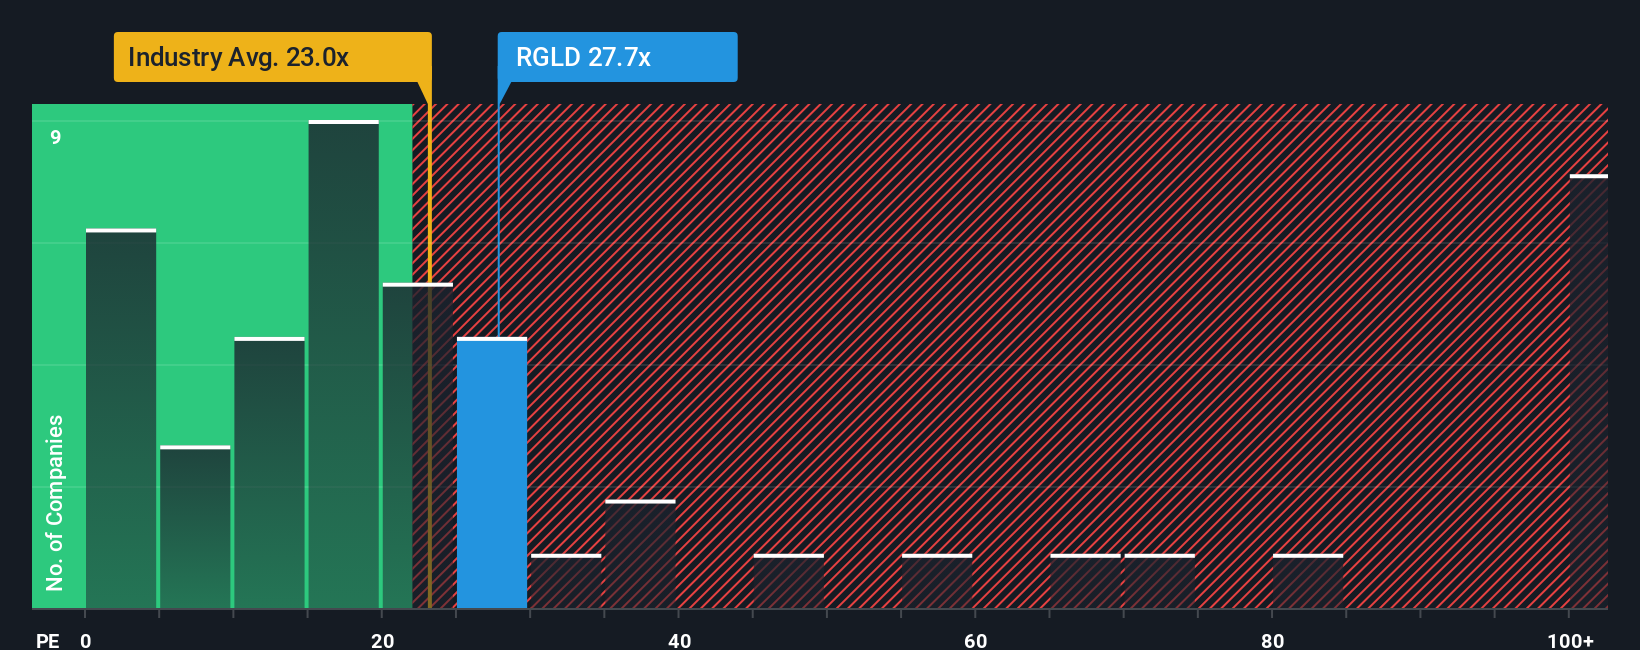
In general, higher growth expectations and lower perceived risk can support a higher P/E, while slower expected growth or higher risk usually point to a lower, more conservative range. Royal Gold currently trades on a P/E of 38.87x, compared with the Metals and Mining industry average of 24.82x and a peer group average of 22.07x. That tells you the market is putting a richer earnings multiple on Royal Gold than on many other miners.
Simply Wall St’s Fair Ratio for Royal Gold is 25.95x. This is a proprietary estimate of what a more balanced P/E could look like after factoring in earnings growth, profit margins, the company’s size, its industry and key risks. Because it blends these elements into a single number, the Fair Ratio can give you a more tailored reference point than a simple comparison with peers or the sector. On this yardstick, Royal Gold’s actual P/E of 38.87x sits above the Fair Ratio, which suggests the shares screen as overvalued on this metric.
Result: OVERVALUED
P/E ratios tell one story, but what if the real opportunity lies elsewhere? Discover 1462 companies where insiders are betting big on explosive growth.
Upgrade Your Decision Making: Choose your Royal Gold Narrative
Earlier we mentioned that there is an even better way to understand valuation. On Simply Wall St’s Community page you can use Narratives, where you set your own story for Royal Gold by linking what you believe about its acquisitions, future revenue, earnings and margins to a financial forecast and fair value. You can then compare that fair value to the current price to help you decide what to do. Your Narrative automatically updates as fresh news or earnings arrive. For example, one Royal Gold Narrative might lean toward the higher fair value of about US$253.91 based on stronger growth and diversification assumptions. A more cautious Narrative could sit closer to the lower analyst price target of US$182 if you put more weight on risks around gold exposure, mine performance, leverage and geopolitics.
Do you think there's more to the story for Royal Gold? Head over to our Community to see what others are saying!
This article by Simply Wall St is general in nature. We provide commentary based on historical data and analyst forecasts only using an unbiased methodology and our articles are not intended to be financial advice. It does not constitute a recommendation to buy or sell any stock, and does not take account of your objectives, or your financial situation. We aim to bring you long-term focused analysis driven by fundamental data. Note that our analysis may not factor in the latest price-sensitive company announcements or qualitative material. Simply Wall St has no position in any stocks mentioned.
Have feedback on this article? Concerned about the content? Get in touch with us directly. Alternatively, email editorial-team@simplywallst.com