
 Nasdaq
 華爾街日報
華爾街日報Assessing Duke Energy (DUK) Valuation As Conflicting Fair Value Estimates Emerge
Duke Energy (DUK) is back on investors’ radar after renewed attention to its role as a large regulated utility in the Southeast and Midwest, prompting a closer look at its recent returns and earnings profile.
See our latest analysis for Duke Energy.
At a share price of $117.44, Duke Energy’s recent 90 day share price return of a 6.47% decline contrasts with its 1 year total shareholder return of 14.40%, suggesting longer term holders have seen steadier momentum than short term traders.
If Duke Energy’s profile has you reassessing your portfolio, it could be worth scanning for income focused utilities and solid balance sheet and fundamentals stocks screener (None results) that pair balance sheet strength with consistency.
With Duke Energy trading at $117.44 and analyst targets sitting higher at $135.76, the question is whether that gap signals mispricing or if the market already reflects its earnings power and future growth potential for utility investors.
Most Popular Narrative Narrative: 13.8% Undervalued
With Duke Energy last closing at $117.44 versus a narrative fair value of about $136.18, the valuation gap has people asking what is driving the difference.
Duke's large-scale commitment to nuclear and renewables (operating the nation's largest regulated nuclear fleet, plus long-term renewables investment pipeline) aligns with the ongoing clean energy transition. This supports regulatory backing and access to production tax credits, which can directly affect earnings and reduce exposure to commodity price volatility.
Want to understand why this earnings story supports a higher value range? The core assumptions blend measured revenue growth, firmer margins, and a richer future earnings multiple. Curious how those moving parts fit together to reach that fair value?
Result: Fair Value of $136.18 (UNDERVALUED)
Have a read of the narrative in full and understand what's behind the forecasts.
However, this story can change quickly if data center projects are delayed or if regulators push back on cost recovery, which could pressure earnings and valuation assumptions.
Find out about the key risks to this Duke Energy narrative.
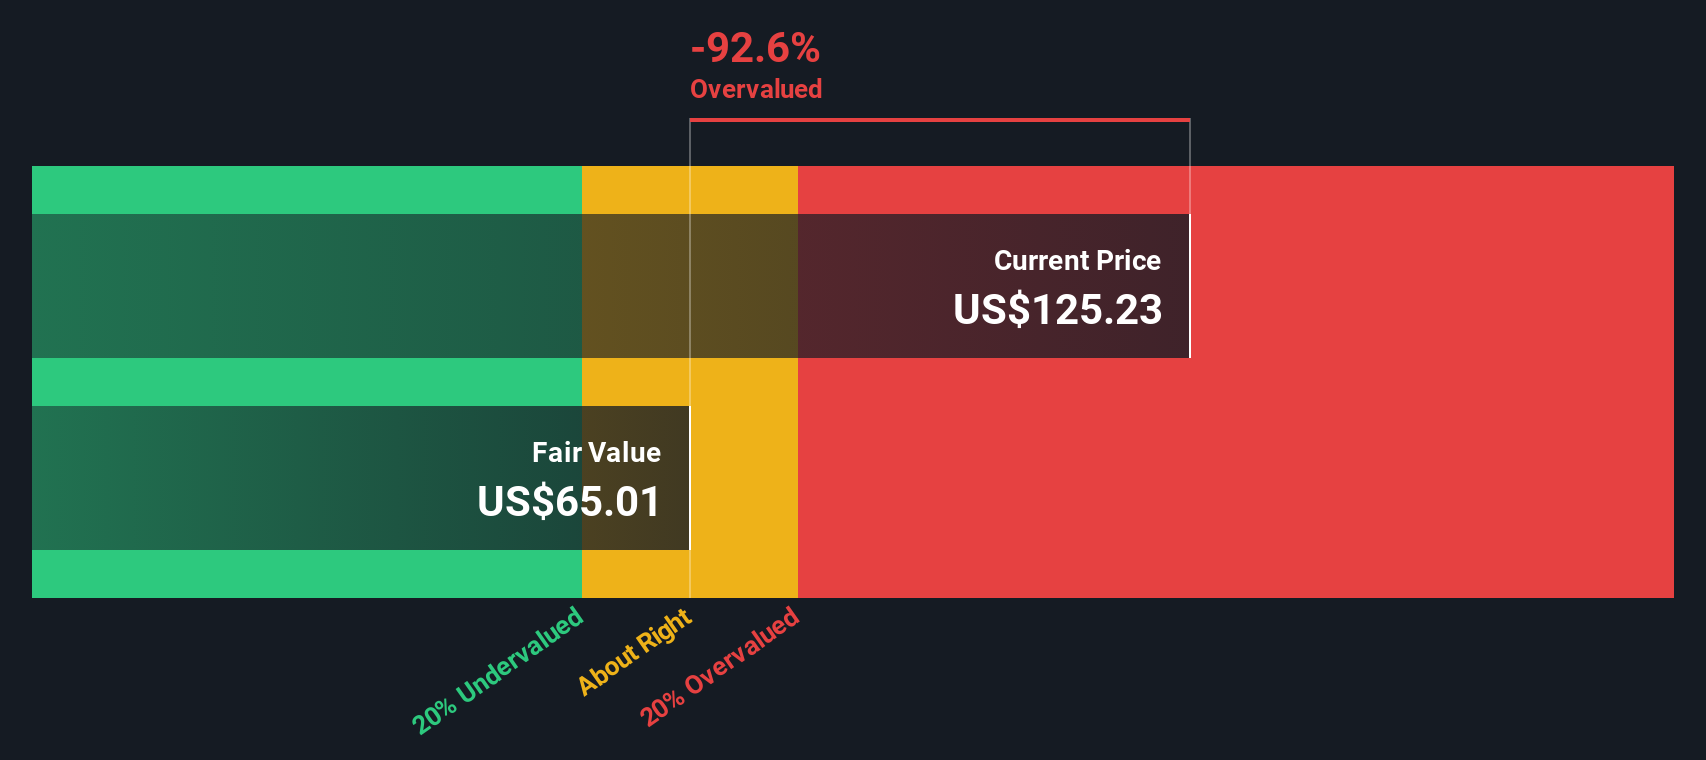
Another View: Our DCF Model Paints A Different Picture
While the narrative fair value suggests Duke looks about 13.8% undervalued, our DCF model tells a very different story. Based on those cash flow assumptions, fair value is closer to $64.38 per share, which would make the current $117.44 price appear expensive rather than cheap. Which set of assumptions do you find more realistic?
Look into how the SWS DCF model arrives at its fair value.
Simply Wall St performs a discounted cash flow (DCF) on every stock in the world every day (check out Duke Energy for example). We show the entire calculation in full. You can track the result in your watchlist or portfolio and be alerted when this changes, or use our stock screener to discover 875 undervalued stocks based on their cash flows. If you save a screener we even alert you when new companies match - so you never miss a potential opportunity.
Build Your Own Duke Energy Narrative
If this conclusion does not align with your view, or you would prefer to test the numbers yourself, you can build a custom thesis in minutes by starting with Do it your way.
A great starting point for your Duke Energy research is our analysis highlighting 4 key rewards and 3 important warning signs that could impact your investment decision.
Looking for more investment ideas?
If Duke Energy has sharpened your thinking, do not stop here. Use the Simply Wall St Screener to spot other opportunities that fit your style.
- Target reliable income by checking out these 14 dividend stocks with yields > 3% that may suit investors who want yields above what cash or basic savings offer.
- Explore long term growth themes with these 29 healthcare AI stocks that connect data, diagnostics, and treatment to potential earnings stories.
- Consider higher risk, higher reward territory through these 3571 penny stocks with strong financials that you can filter by fundamentals instead of headlines.
This article by Simply Wall St is general in nature. We provide commentary based on historical data and analyst forecasts only using an unbiased methodology and our articles are not intended to be financial advice. It does not constitute a recommendation to buy or sell any stock, and does not take account of your objectives, or your financial situation. We aim to bring you long-term focused analysis driven by fundamental data. Note that our analysis may not factor in the latest price-sensitive company announcements or qualitative material. Simply Wall St has no position in any stocks mentioned.
Have feedback on this article? Concerned about the content? Get in touch with us directly. Alternatively, email editorial-team@simplywallst.com