
 Nasdaq
 華爾街日報
華爾街日報JFrog (FROG) Valuation Check After 3-Month Rally and Recent Share Price Pullback
JFrog (FROG) has quietly become a stock worth a closer look, with shares sliding about 10% over the past week but still up roughly 25% in the past 3 months.
See our latest analysis for JFrog.
At around $59.57 per share, JFrog has given investors a 1 year total shareholder return of about 91%, on top of a strong 3 month share price rebound. This suggests momentum is still very much alive despite the recent pullback.
If that kind of move has you wondering what else could be setting up for the next leg higher, it is worth exploring high growth tech and AI stocks as potential candidates for your watchlist.
But after such a powerful run, especially with analysts still seeing nearly 20% upside to their price targets, is JFrog quietly trading below its true potential, or is the market already pricing in years of future growth?
Most Popular Narrative: 13.9% Undervalued
With JFrog last closing at $59.57 against a narrative fair value of about $69.22, the story points to meaningful upside still on the table.
The need for hybrid and multi-cloud deployment models is intensifying as organizations seek cost predictability, compliance, and flexibility when running AI workloads. JFrog's platform, architected from inception for both cloud and on-prem/hybrid, appeals to enterprises facing this complexity, helping to secure large, multi-year enterprise contracts, boost retention, and expand average deal size.
Want to see what kind of revenue runway and future margins that vision demands? The narrative leans on bold growth math and an aggressive future earnings multiple. Curious how those moving parts combine into that higher fair value, and what has to go right along the way?
Result: Fair Value of $69.22 (UNDERVALUED)
Have a read of the narrative in full and understand what's behind the forecasts.
However, this optimism could be challenged if enterprise deal cycles lengthen or security competition intensifies, pressuring both growth assumptions and the premium valuation.
Find out about the key risks to this JFrog narrative.
Another Lens on Valuation
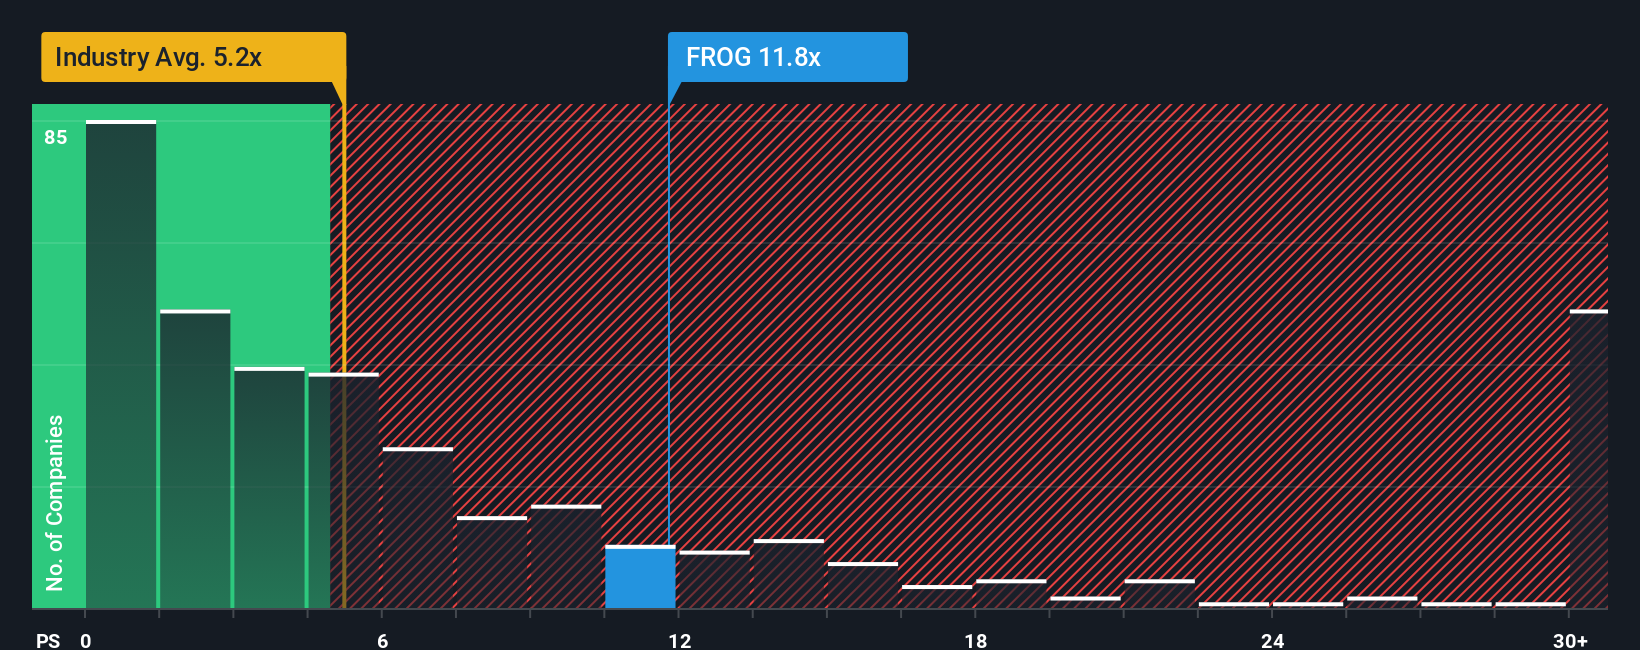
On price to sales, JFrog tells a very different story. The stock trades at about 14 times sales versus 4.7 times for the US software sector and 5.9 times for peers, while our fair ratio sits nearer 7 times. That kind of gap suggests real valuation risk if sentiment cools.
See what the numbers say about this price — find out in our valuation breakdown.
Build Your Own JFrog Narrative
If you see the story differently or want to dig into the numbers yourself, you can build a personalized narrative in just minutes: Do it your way.
A great starting point for your JFrog research is our analysis highlighting 1 key reward and 2 important warning signs that could impact your investment decision.
Ready for your next investing edge?
Do not stop with a single opportunity. Use the Simply Wall St Screener to uncover focused sets of stocks aligned with how you actually want to invest.
- Capture potential mispricings by scanning these 875 undervalued stocks based on cash flows that could offer stronger upside if the market closes the gap.
- Position your portfolio for tomorrow's breakthroughs by targeting these 25 AI penny stocks riding powerful secular trends in automation and intelligent software.
- Reinforce your income strategy by zeroing in on these 14 dividend stocks with yields > 3% that may keep paying you while the market debates the next move.
This article by Simply Wall St is general in nature. We provide commentary based on historical data and analyst forecasts only using an unbiased methodology and our articles are not intended to be financial advice. It does not constitute a recommendation to buy or sell any stock, and does not take account of your objectives, or your financial situation. We aim to bring you long-term focused analysis driven by fundamental data. Note that our analysis may not factor in the latest price-sensitive company announcements or qualitative material. Simply Wall St has no position in any stocks mentioned.
Have feedback on this article? Concerned about the content? Get in touch with us directly. Alternatively, email editorial-team@simplywallst.com