
 Nasdaq
 華爾街日報
華爾街日報Hawkins (HWKN) Valuation Check After Strong Long-Term Returns and Recent Share Price Pullback
Recent performance and context
Hawkins (HWKN) has quietly outperformed over the past year, even after a pullback in the past 3 months, so it is a good time to revisit what is driving the stock.
See our latest analysis for Hawkins.
The latest 1 month share price return of 5.75 percent contrasts with a 90 day share price pullback of 20.86 percent. However, the 1 year total shareholder return of 18.8 percent and standout 5 year total shareholder return of 453 percent suggest longer term momentum is still firmly intact around Hawkins growth story and steadier demand for its water treatment and specialty ingredients business.
If Hawkins strong long term total shareholder returns have you thinking about what else could surprise on the upside, this is a good moment to explore fast growing stocks with high insider ownership.
Yet with shares still below analyst targets but trading on rich long term gains, the key question now is whether Hawkins remains undervalued or if the market is already pricing in its next leg of growth.
Price-to-Earnings of 36.5x: Is it justified?
Hawkins last closed at $145.28, yet on a price-to-earnings basis it screens as expensive versus both its sector and peers, implying rich expectations are already embedded.
The price-to-earnings ratio compares the current share price to the company’s earnings per share, so a higher multiple means investors are paying more for each dollar of profit. For a mature but steadily growing chemicals and water treatment business, this can signal that the market is baking in continued earnings resilience and incremental growth rather than deep value.
In Hawkins case, earnings have grown at a healthy pace over the past five years and are still forecast to rise, but at mid single digit rates rather than rapid expansion. Against that backdrop, a multiple of 36.5x looks demanding, especially when the estimated fair price-to-earnings ratio of 16.9x points to a level the market could revert toward if sentiment cools and growth assumptions normalise.
That premium stands out sharply when stacked against both the US Chemicals industry average price-to-earnings of 23.7x and the peer group average of 25.7x, underlining how far Hawkins has rerated beyond its closest comparisons and the level at which the market may eventually seek equilibrium.
Explore the SWS fair ratio for Hawkins
Result: Price-to-Earnings of 36.5x (OVERVALUED)
However, Hawkins’ premium valuation could be vulnerable if municipal and industrial water spending slows, or if margin pressure undercuts the steady earnings growth investors expect.
Find out about the key risks to this Hawkins narrative.
Another view on value
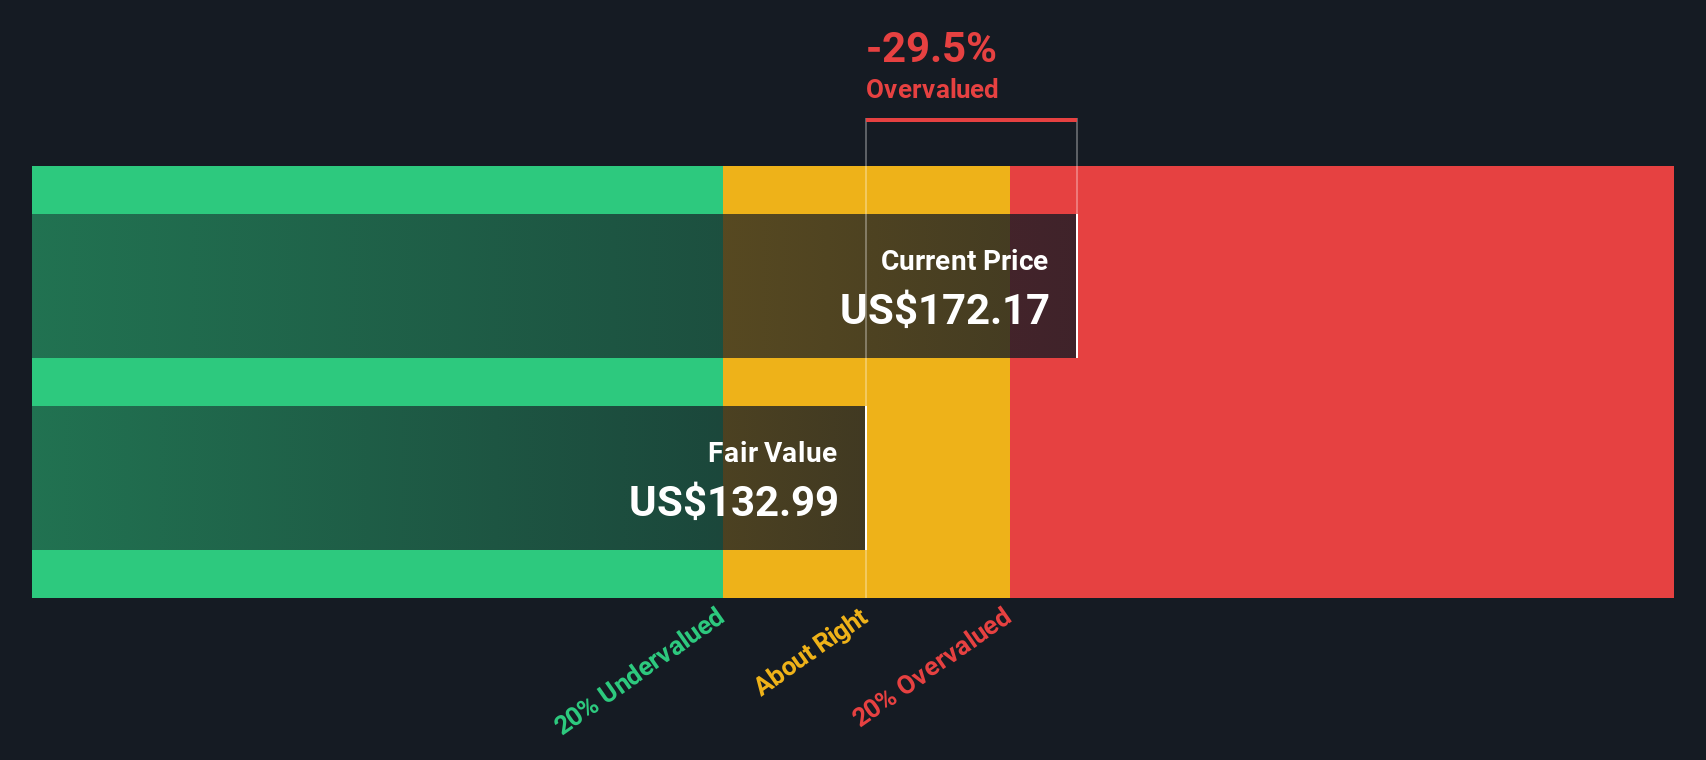
Our DCF model points the other way, suggesting Hawkins is overvalued at $145.28 versus an estimated fair value of $99.07. If cash flows matter more than market multiples, could today’s price be baking in too much optimism, or are the forecasts simply too conservative?
Look into how the SWS DCF model arrives at its fair value.
Simply Wall St performs a discounted cash flow (DCF) on every stock in the world every day (check out Hawkins for example). We show the entire calculation in full. You can track the result in your watchlist or portfolio and be alerted when this changes, or use our stock screener to discover 875 undervalued stocks based on their cash flows. If you save a screener we even alert you when new companies match - so you never miss a potential opportunity.
Build Your Own Hawkins Narrative
If you take a different view or simply want to dig into the numbers yourself, you can shape a personalised Hawkins outlook in just minutes, Do it your way.
A great starting point for your Hawkins research is our analysis highlighting 3 key rewards and 1 important warning sign that could impact your investment decision.
Looking for more investment ideas?
Before you move on, make your next 15 minutes count by lining up fresh opportunities through the Simply Wall St Screener so you are not relying on just one story.
- Position yourself early in potential multi-baggers by scanning these 3571 penny stocks with strong financials that already show stronger financial foundations than most tiny names ever achieve.
- Capitalize on the next wave of automation and data intelligence by targeting these 25 AI penny stocks poised to benefit as AI spending accelerates across industries.
- Lock in a smoother income stream by focusing on these 14 dividend stocks with yields > 3% that can help support your returns even when markets turn choppy.
This article by Simply Wall St is general in nature. We provide commentary based on historical data and analyst forecasts only using an unbiased methodology and our articles are not intended to be financial advice. It does not constitute a recommendation to buy or sell any stock, and does not take account of your objectives, or your financial situation. We aim to bring you long-term focused analysis driven by fundamental data. Note that our analysis may not factor in the latest price-sensitive company announcements or qualitative material. Simply Wall St has no position in any stocks mentioned.
Have feedback on this article? Concerned about the content? Get in touch with us directly. Alternatively, email editorial-team@simplywallst.com