
 Nasdaq
 華爾街日報
華爾街日報Undiscovered Gems in Asia for January 2026
As we step into January 2026, the Asian markets have been capturing attention with mixed performances across key indices. While Japan's stock market has seen declines in a holiday-shortened week, China's manufacturing sector shows signs of recovery, suggesting potential opportunities for investors seeking to explore small-cap stocks in the region. In such an environment, identifying promising stocks involves looking for companies that demonstrate resilience and potential for growth amidst evolving economic conditions.
Top 10 Undiscovered Gems With Strong Fundamentals In Asia
| Name | Debt To Equity | Revenue Growth | Earnings Growth | Health Rating |
|---|---|---|---|---|
| Hongmian Zhihui Science and Technology InnovationLtd.Guangzhou | 17.36% | -10.02% | 57.60% | ★★★★★★ |
| Tibet Development | 13.94% | -0.13% | 42.61% | ★★★★★★ |
| Synergy Innovation | 11.47% | 14.41% | 54.74% | ★★★★★★ |
| Suzhou Fushilai Pharmaceutical | NA | -6.05% | -29.68% | ★★★★★★ |
| KC | 3.08% | 7.56% | 0.51% | ★★★★★☆ |
| Zhejiang Wanfeng ChemicalLtd | 12.30% | 0.64% | -19.71% | ★★★★★☆ |
| Champion Building MaterialsLtd | 35.20% | -0.61% | -2.99% | ★★★★★☆ |
| Poly Plastic Masterbatch (SuZhou)Ltd | 4.59% | 17.51% | 3.97% | ★★★★★☆ |
| Hollyland (China) Electronics Technology | 6.10% | 17.97% | 20.67% | ★★★★★☆ |
| Anfu CE LINK | 70.49% | 7.92% | -8.47% | ★★★★☆☆ |
Let's uncover some gems from our specialized screener.
DL Holdings Group (SEHK:1709)
Simply Wall St Value Rating: ★★★★☆☆
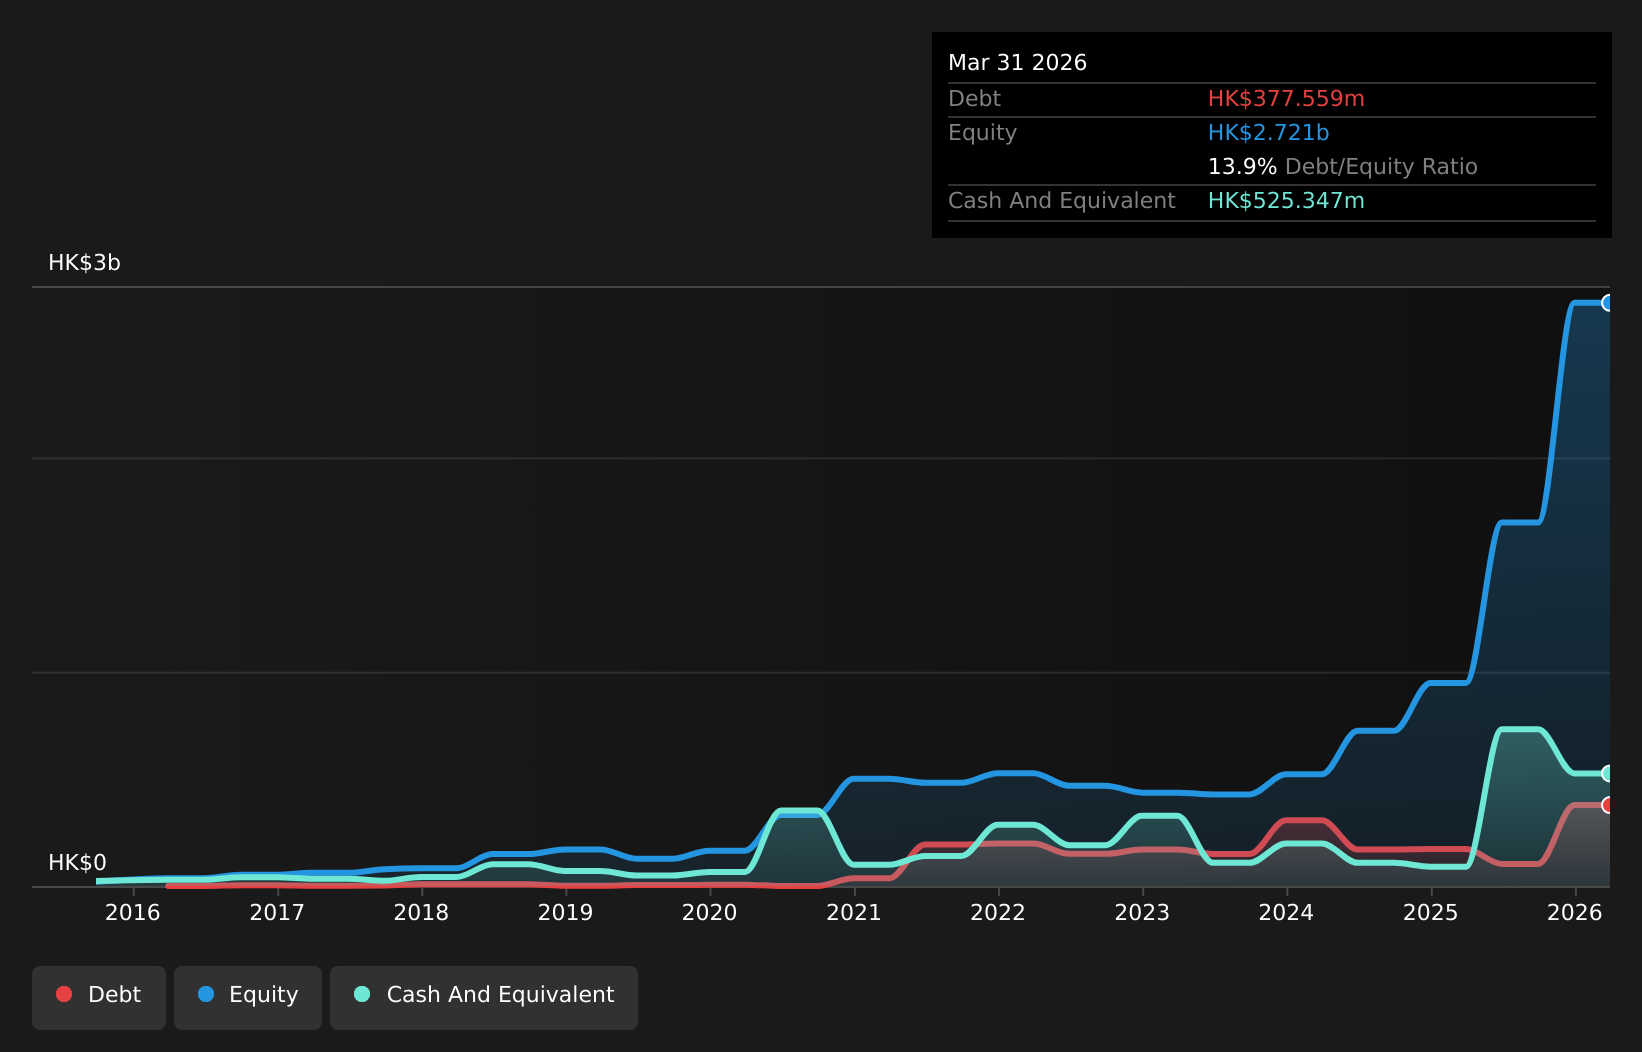
Overview: DL Holdings Group Limited is an investment holding company that operates in the financial services sector, with a market capitalization of HK$4.57 billion.
Operations: DL Holdings Group generates revenue primarily from its financial services of licensed business (HK$135.25 million) and family office services business (HK$63.93 million). The company also earns from enterprise solutions services and sales of apparel products, contributing HK$9.34 million and HK$5.95 million respectively. The net profit margin is a key indicator to consider when analyzing the company's financial performance over time.
DL Holdings Group, a promising player in the financial sector, has seen its earnings skyrocket by 227% over the past year, outpacing industry growth. With a price-to-earnings ratio of 13.9x, it offers better value than the industry average of 19.8x. Despite a volatile share price recently, DL Holdings maintains more cash than total debt and showcases high-quality non-cash earnings. The company's recent strategic cooperation with Antalpha aims to enhance its Bitcoin mining capabilities and integrate digital assets into traditional finance channels, potentially unlocking new market opportunities and reinforcing its position in Asia's digital asset landscape.
- Click here and access our complete health analysis report to understand the dynamics of DL Holdings Group.
Gain insights into DL Holdings Group's past trends and performance with our Past report.
AblePrint Technology (TPEX:7734)
Simply Wall St Value Rating: ★★★★★☆
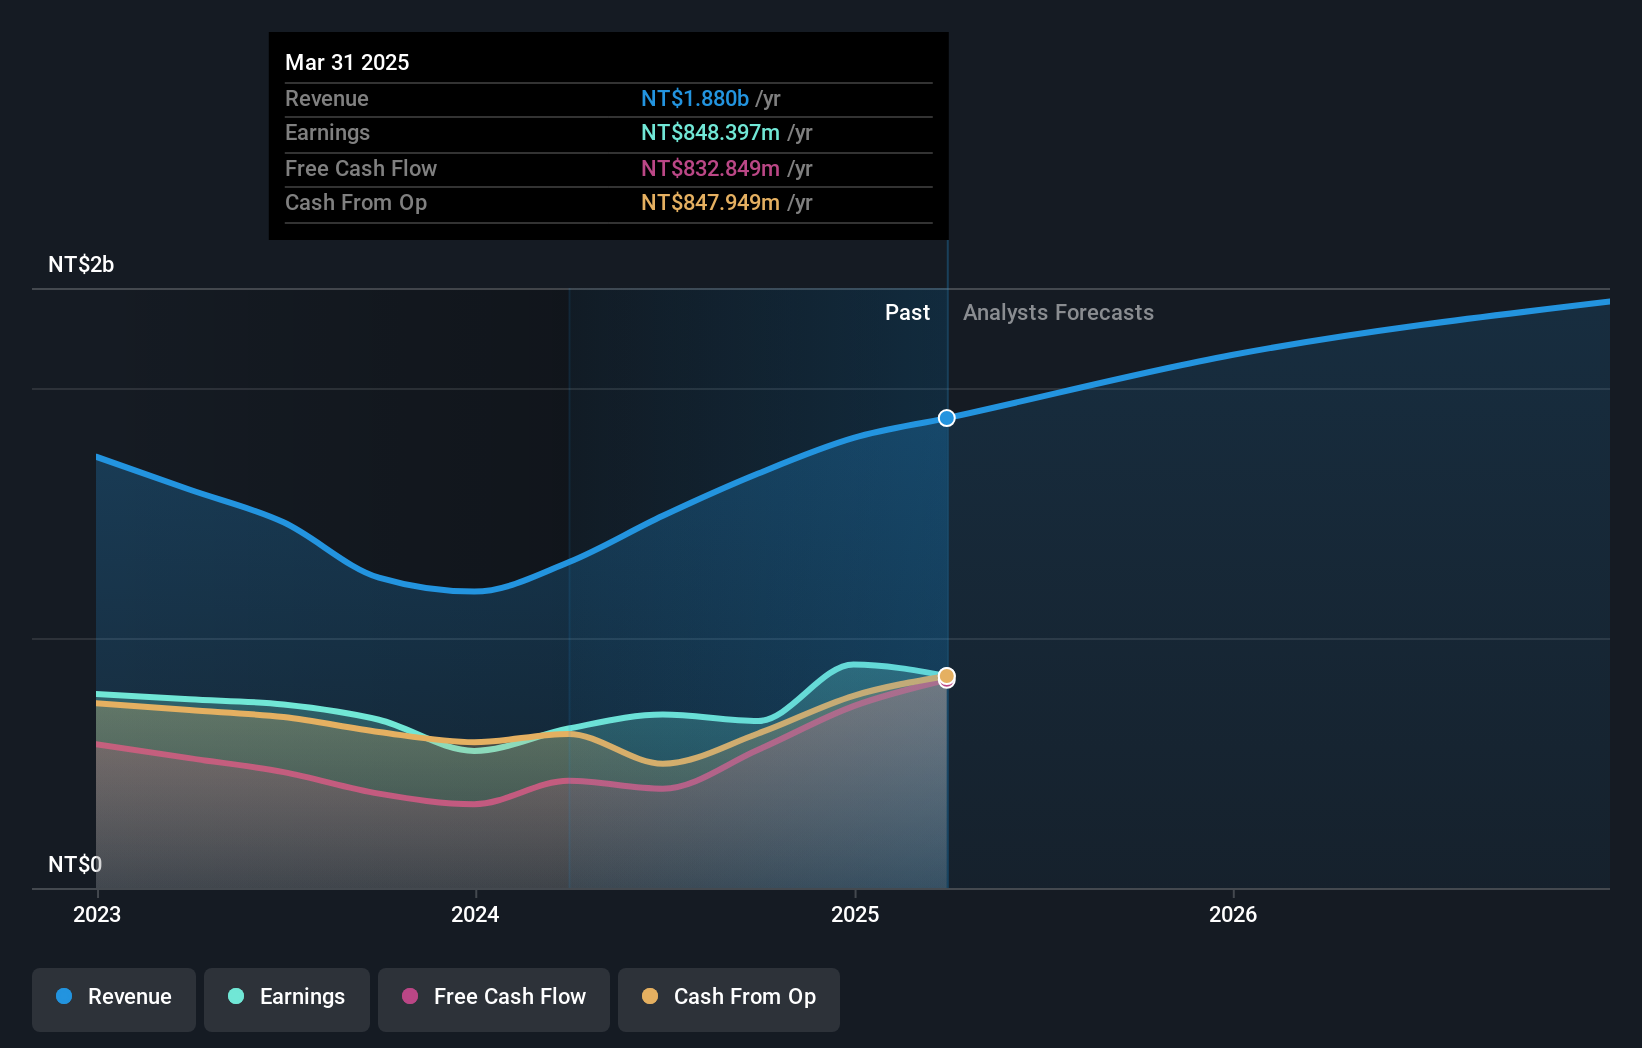
Overview: AblePrint Technology Co., Ltd. is a process solution provider addressing process issues for multiple industries both in Taiwan and globally, with a market capitalization of NT$27.69 billion.
Operations: AblePrint Technology generates revenue primarily from its Pneumatic and Thermal Process Solutions, which account for NT$1.62 billion, and Automation System Solutions contributing NT$465.44 million.
AblePrint Technology has shown impressive growth, with earnings surging 51.4% over the past year, outpacing the Semiconductor industry’s modest 2.5%. This small company reported third-quarter sales of TWD 713 million, a significant jump from TWD 394 million a year earlier. Net income rose to TWD 339 million from TWD 98 million in the same period last year. The price-to-earnings ratio stands at a favorable 27.4x, below the industry average of 30.1x, suggesting potential value for investors seeking opportunities in Asia's tech sector. With positive free cash flow and adequate interest coverage, AblePrint appears financially robust for future endeavors.
- Get an in-depth perspective on AblePrint Technology's performance by reading our health report here.
Walsin Technology (TWSE:2492)
Simply Wall St Value Rating: ★★★★★☆
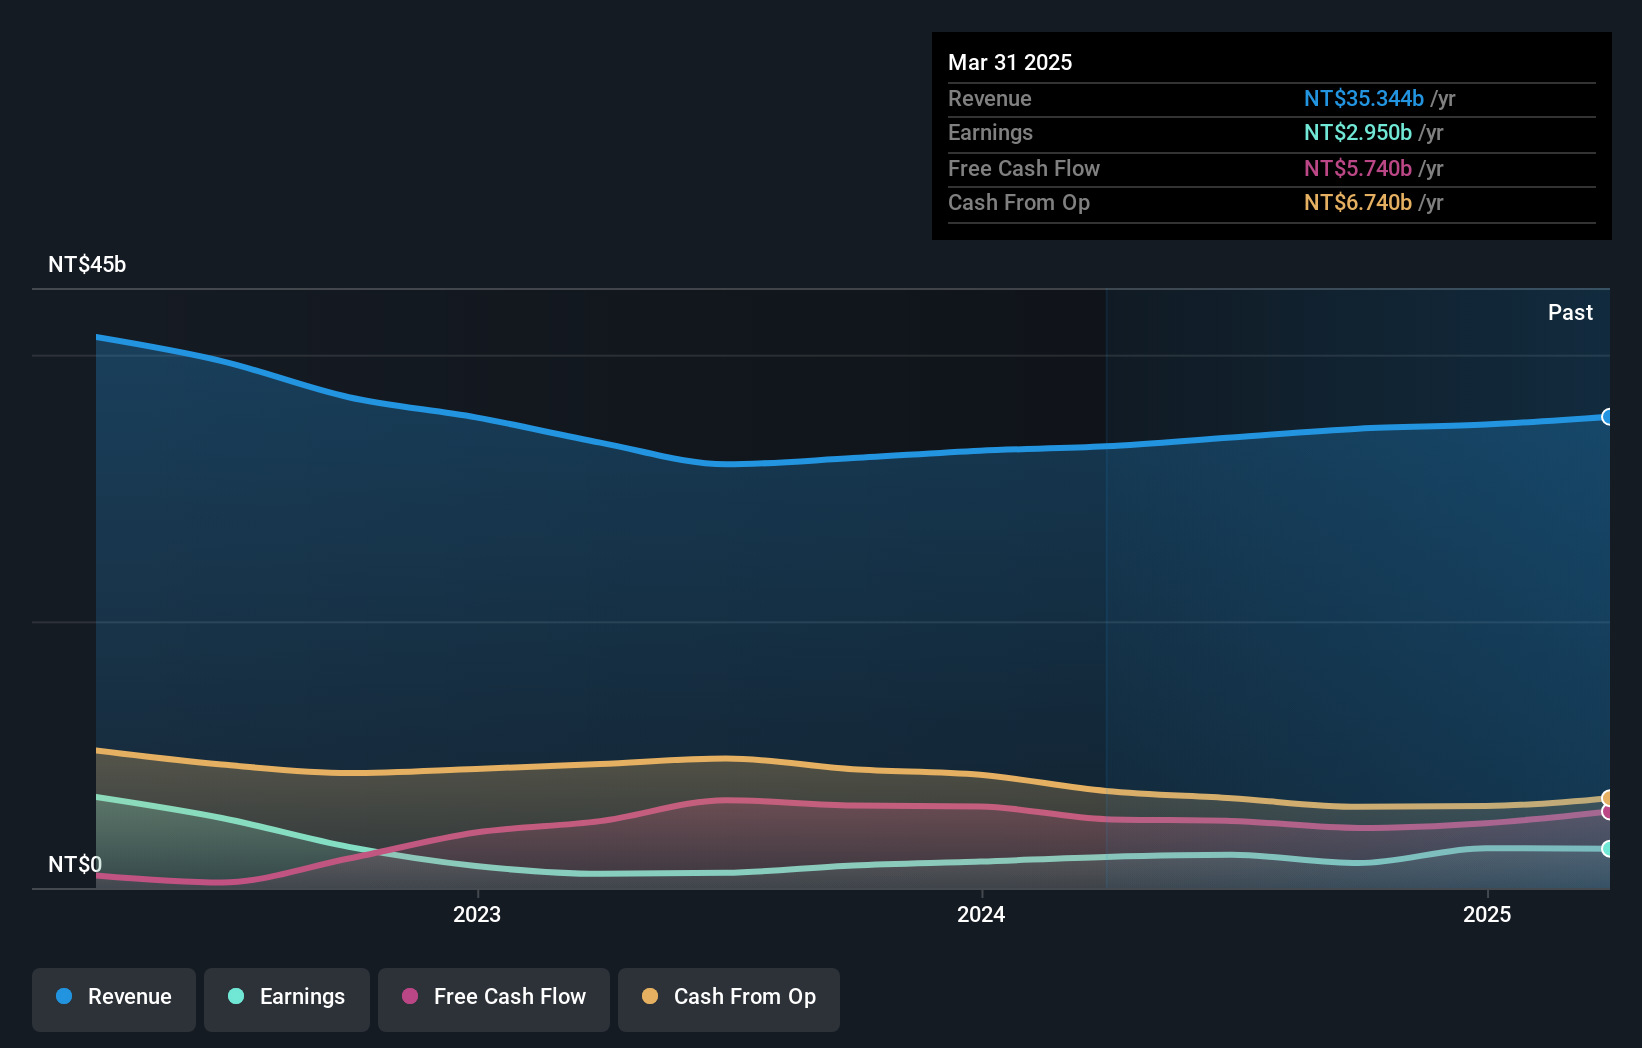
Overview: Walsin Technology Corporation, with a market cap of approximately NT$60.36 billion, develops, manufactures, and sells passive electronic components across Asia, America, and Europe.
Operations: Walsin Technology's revenue is primarily driven by Segment A, contributing NT$24.80 billion, followed by Segment C at NT$7.69 billion and Segment B at NT$4.02 billion. The company's net profit margin exhibits notable trends over recent periods, reflecting its operational efficiency amidst varying market conditions.
Walsin Technology, a notable player in the Asian electronics sector, has shown mixed financial performance recently. Despite a satisfactory net debt to equity ratio of 34.9%, earnings have experienced an annual decline of 33.1% over five years. However, the past year's earnings growth of 25.6% outpaced the industry's 6.6%, indicating potential recovery momentum. The company reported third-quarter sales of TWD 9,413 million and net income at TWD 1,058 million, reflecting improved profitability compared to last year’s figures for the same period. With high-quality past earnings and positive free cash flow, Walsin maintains a solid foundation amidst market volatility.
- Take a closer look at Walsin Technology's potential here in our health report.
Explore historical data to track Walsin Technology's performance over time in our Past section.
Make It Happen
- Click here to access our complete index of 2501 Asian Undiscovered Gems With Strong Fundamentals.
- Already own these companies? Link your portfolio to Simply Wall St and get alerts on any new warning signs to your stocks.
- Join a community of smart investors by using Simply Wall St. It's free and delivers expert-level analysis on worldwide markets.
Interested In Other Possibilities?
- Explore high-performing small cap companies that haven't yet garnered significant analyst attention.
- Fuel your portfolio with companies showing strong growth potential, backed by optimistic outlooks both from analysts and management.
- Find companies with promising cash flow potential yet trading below their fair value.
This article by Simply Wall St is general in nature. We provide commentary based on historical data and analyst forecasts only using an unbiased methodology and our articles are not intended to be financial advice. It does not constitute a recommendation to buy or sell any stock, and does not take account of your objectives, or your financial situation. We aim to bring you long-term focused analysis driven by fundamental data. Note that our analysis may not factor in the latest price-sensitive company announcements or qualitative material. Simply Wall St has no position in any stocks mentioned.
Have feedback on this article? Concerned about the content? Get in touch with us directly. Alternatively, email editorial-team@simplywallst.com