
 Nasdaq
 華爾街日報
華爾街日報Yadea Group Holdings Ltd. (HKG:1585) Top Key Executive Jinggui Dong, the company's largest shareholder sees 3.8%reduction in holdings value
Key Insights
- Significant insider control over Yadea Group Holdings implies vested interests in company growth
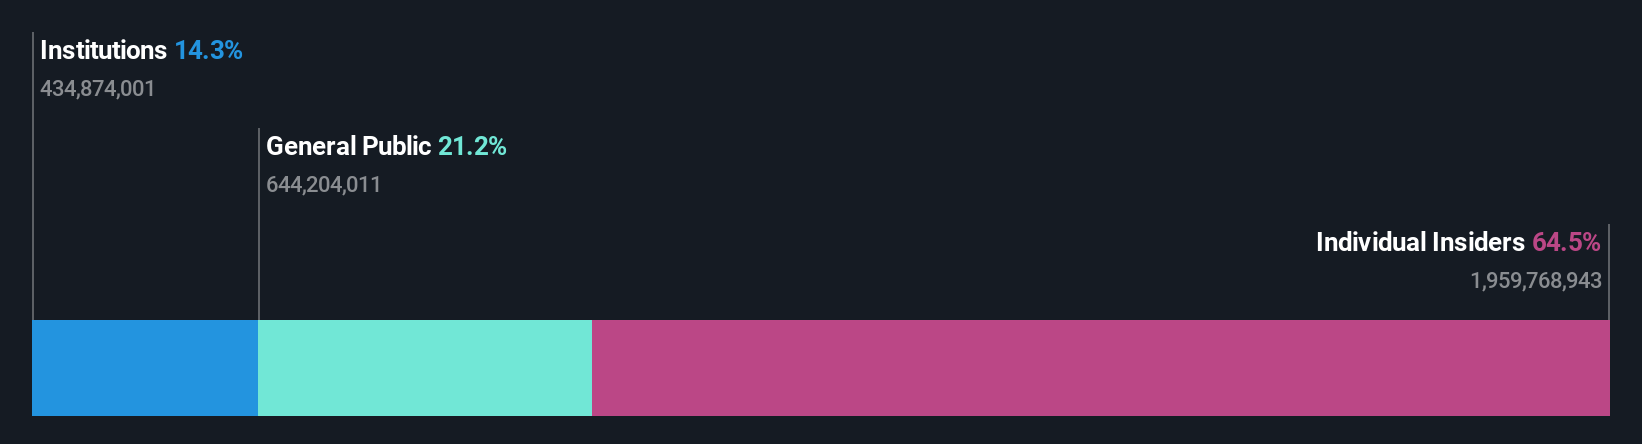
- The top 2 shareholders own 64% of the company
- Institutions own 14% of Yadea Group Holdings
If you want to know who really controls Yadea Group Holdings Ltd. (HKG:1585), then you'll have to look at the makeup of its share registry. With 64% stake, individual insiders possess the maximum shares in the company. Put another way, the group faces the maximum upside potential (or downside risk).
As a result, insiders as a group endured the highest losses after market cap fell by HK$1.4b.
Let's take a closer look to see what the different types of shareholders can tell us about Yadea Group Holdings.
View our latest analysis for Yadea Group Holdings
What Does The Institutional Ownership Tell Us About Yadea Group Holdings?
Many institutions measure their performance against an index that approximates the local market. So they usually pay more attention to companies that are included in major indices.
We can see that Yadea Group Holdings does have institutional investors; and they hold a good portion of the company's stock. This suggests some credibility amongst professional investors. But we can't rely on that fact alone since institutions make bad investments sometimes, just like everyone does. If multiple institutions change their view on a stock at the same time, you could see the share price drop fast. It's therefore worth looking at Yadea Group Holdings' earnings history below. Of course, the future is what really matters.

Hedge funds don't have many shares in Yadea Group Holdings. From our data, we infer that the largest shareholder is Jinggui Dong (who also holds the title of Top Key Executive) with 48% of shares outstanding. Its usually considered a good sign when insiders own a significant number of shares in the company, and in this case, we're glad to see a company insider play the role of a key stakeholder. For context, the second largest shareholder holds about 17% of the shares outstanding, followed by an ownership of 1.9% by the third-largest shareholder. Interestingly, the second-largest shareholder, Jinghong Qian is also Chief Executive Officer, again, pointing towards strong insider ownership amongst the company's top shareholders.
After doing some more digging, we found that the top 2 shareholders collectively control more than half of the company's shares, implying that they have considerable power to influence the company's decisions.
While it makes sense to study institutional ownership data for a company, it also makes sense to study analyst sentiments to know which way the wind is blowing. There are plenty of analysts covering the stock, so it might be worth seeing what they are forecasting, too.
Insider Ownership Of Yadea Group Holdings
While the precise definition of an insider can be subjective, almost everyone considers board members to be insiders. Company management run the business, but the CEO will answer to the board, even if he or she is a member of it.
Insider ownership is positive when it signals leadership are thinking like the true owners of the company. However, high insider ownership can also give immense power to a small group within the company. This can be negative in some circumstances.
Our most recent data indicates that insiders own the majority of Yadea Group Holdings Ltd.. This means they can collectively make decisions for the company. That means insiders have a very meaningful HK$23b stake in this HK$35b business. Most would argue this is a positive, showing strong alignment with shareholders. You can click here to see if they have been selling down their stake.
General Public Ownership
The general public, who are usually individual investors, hold a 21% stake in Yadea Group Holdings. While this size of ownership may not be enough to sway a policy decision in their favour, they can still make a collective impact on company policies.
Next Steps:
I find it very interesting to look at who exactly owns a company. But to truly gain insight, we need to consider other information, too.
I like to dive deeper into how a company has performed in the past. You can find historic revenue and earnings in this detailed graph.
But ultimately it is the future, not the past, that will determine how well the owners of this business will do. Therefore we think it advisable to take a look at this free report showing whether analysts are predicting a brighter future.
NB: Figures in this article are calculated using data from the last twelve months, which refer to the 12-month period ending on the last date of the month the financial statement is dated. This may not be consistent with full year annual report figures.
Have feedback on this article? Concerned about the content? Get in touch with us directly. Alternatively, email editorial-team (at) simplywallst.com.
This article by Simply Wall St is general in nature. We provide commentary based on historical data and analyst forecasts only using an unbiased methodology and our articles are not intended to be financial advice. It does not constitute a recommendation to buy or sell any stock, and does not take account of your objectives, or your financial situation. We aim to bring you long-term focused analysis driven by fundamental data. Note that our analysis may not factor in the latest price-sensitive company announcements or qualitative material. Simply Wall St has no position in any stocks mentioned.