
 Nasdaq
 華爾街日報
華爾街日報TSX Penny Stock Insights Featuring Pulse Seismic And Two More Companies
As the Canadian market navigates a landscape of sector-specific opportunities and challenges, diversification remains a key strategy for investors. Penny stocks, though often seen as niche investments, continue to offer intriguing prospects for those seeking growth in smaller or newer companies. With financial strength as a guiding criterion, we examine several penny stocks that could potentially offer both stability and long-term potential.
Top 10 Penny Stocks In Canada
| Name | Share Price | Market Cap | Rewards & Risks |
| Westbridge Renewable Energy (TSXV:WEB) | CA$2.15 | CA$54.35M | ✅ 3 ⚠️ 4 View Analysis > |
| Sailfish Royalty (TSXV:FISH) | CA$3.33 | CA$253.93M | ✅ 1 ⚠️ 4 View Analysis > |
| Zoomd Technologies (TSXV:ZOMD) | CA$1.20 | CA$120.95M | ✅ 4 ⚠️ 2 View Analysis > |
| Montero Mining and Exploration (TSXV:MON) | CA$0.415 | CA$3.47M | ✅ 2 ⚠️ 3 View Analysis > |
| CEMATRIX (TSX:CEMX) | CA$0.36 | CA$53.98M | ✅ 3 ⚠️ 1 View Analysis > |
| Thor Explorations (TSXV:THX) | CA$1.27 | CA$844.93M | ✅ 3 ⚠️ 2 View Analysis > |
| Automotive Finco (TSXV:AFCC.H) | CA$1.20 | CA$23.78M | ✅ 2 ⚠️ 3 View Analysis > |
| Pulse Seismic (TSX:PSD) | CA$3.29 | CA$166.88M | ✅ 2 ⚠️ 1 View Analysis > |
| Caldwell Partners International (TSX:CWL) | CA$1.02 | CA$30.04M | ✅ 1 ⚠️ 4 View Analysis > |
| Hemisphere Energy (TSXV:HME) | CA$1.97 | CA$186.41M | ✅ 3 ⚠️ 2 View Analysis > |
Click here to see the full list of 385 stocks from our TSX Penny Stocks screener.
We're going to check out a few of the best picks from our screener tool.
Pulse Seismic (TSX:PSD)
Simply Wall St Financial Health Rating: ★★★★★★
Overview: Pulse Seismic Inc. is a company that acquires, markets, and licenses 2D and 3D seismic data for the energy sector in Canada, with a market cap of CA$166.88 million.
Operations: The company's revenue primarily comes from its Oil Well Equipment & Services segment, generating CA$50.07 million.
Market Cap: CA$166.88M
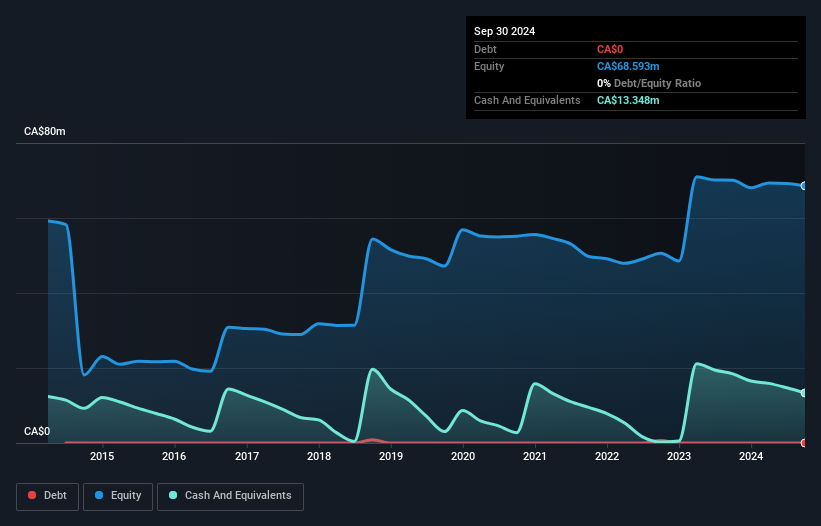
Pulse Seismic Inc. demonstrates a strong financial position with no debt, high-quality earnings, and outstanding return on equity at 133.5%. Despite reporting a net loss of CA$1.5 million in the recent quarter, its nine-month net income surged to CA$21.44 million from CA$2.62 million the previous year, reflecting significant earnings growth of 103.4% over the past year—outpacing both its historical average and industry peers. The company maintains an unstable dividend track record but recently declared a quarterly dividend of CA$0.0175 per share while completing a minor share buyback program earlier this year without further dilution to shareholders.
- Get an in-depth perspective on Pulse Seismic's performance by reading our balance sheet health report here.
- Explore historical data to track Pulse Seismic's performance over time in our past results report.
FPX Nickel (TSXV:FPX)
Simply Wall St Financial Health Rating: ★★★★★★
Overview: FPX Nickel Corp. is a junior mining company focused on the acquisition, exploration, and development of nickel resource properties in Canada with a market cap of CA$163.63 million.
Operations: FPX Nickel Corp. has not reported any revenue segments.
Market Cap: CA$163.63M
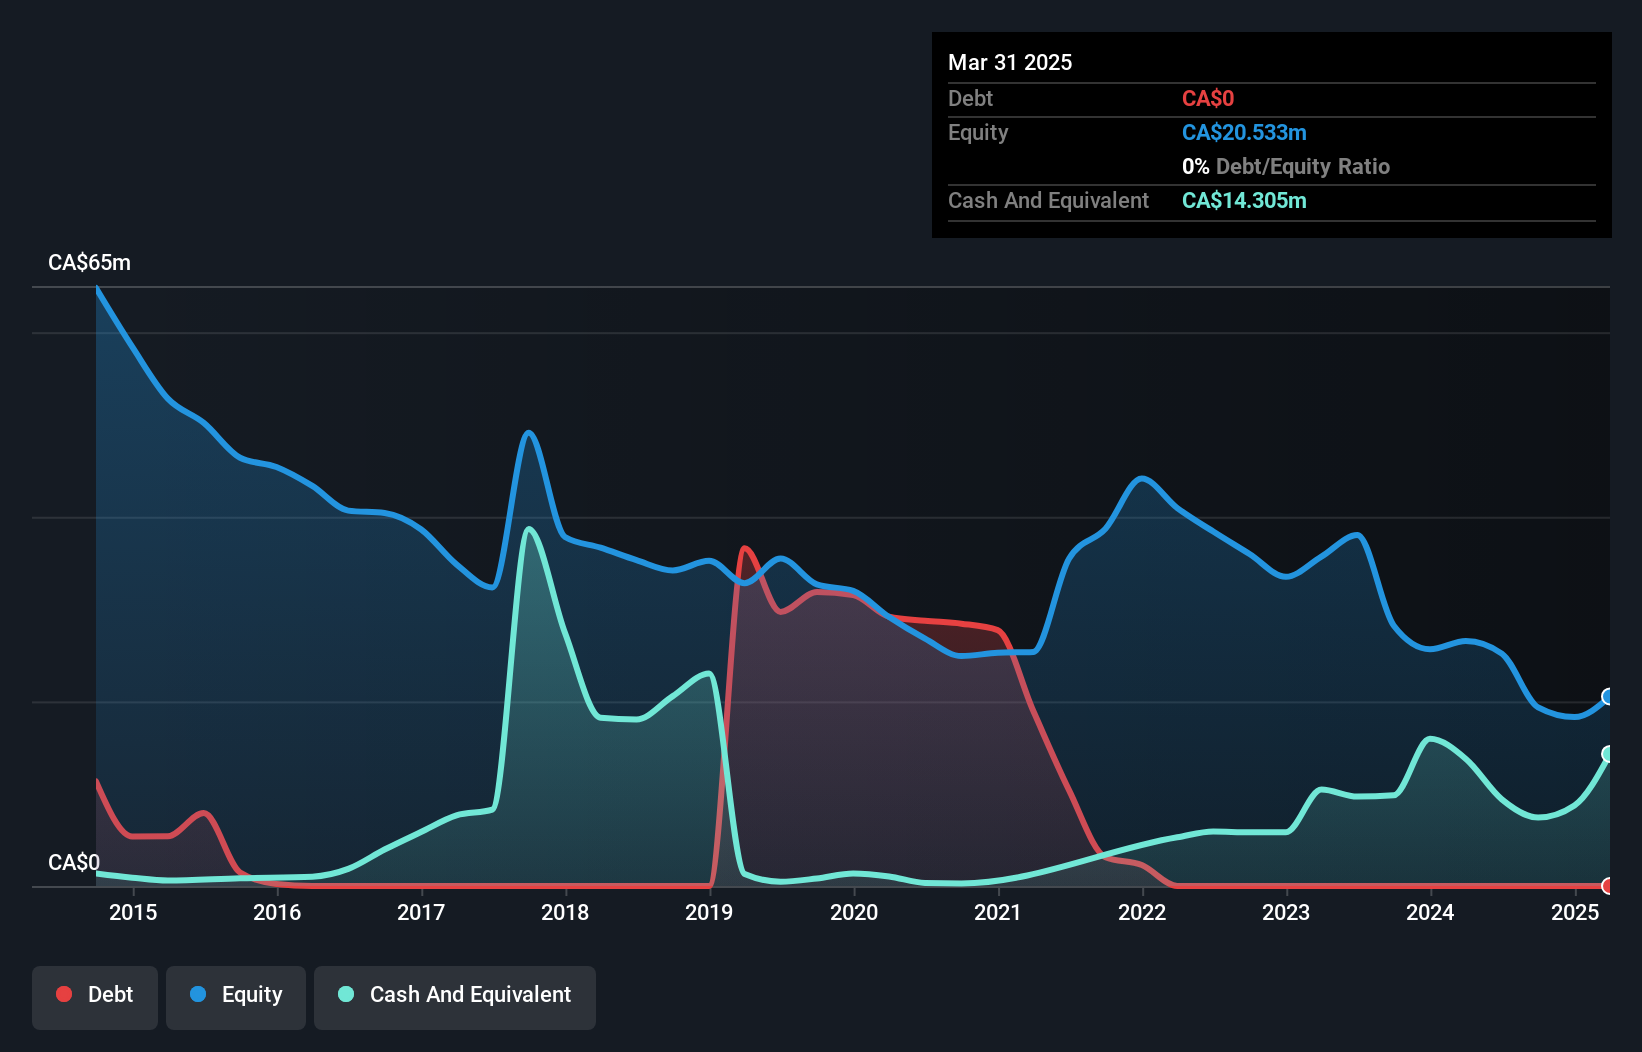
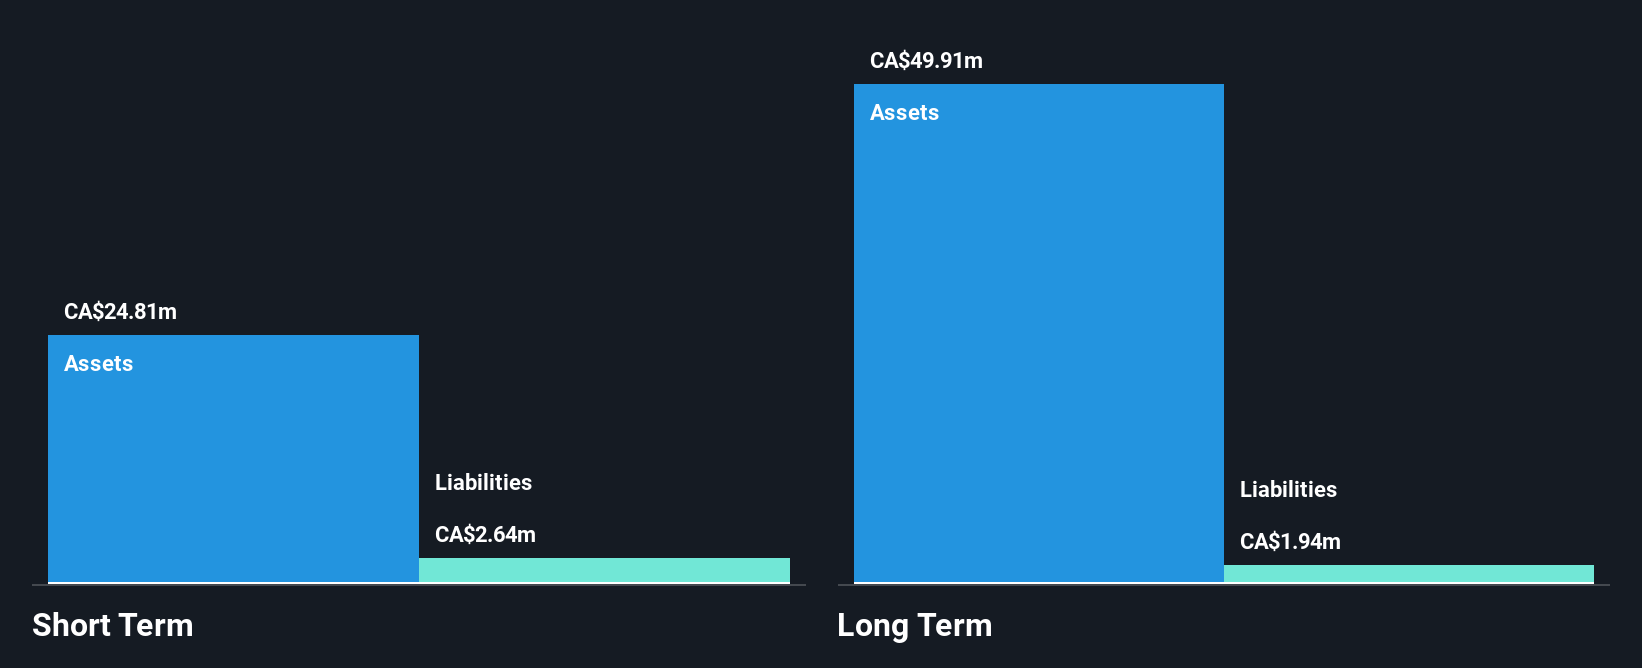
FPX Nickel Corp., with a market cap of CA$163.63 million, remains pre-revenue and unprofitable, reporting increased losses over the past five years. Despite this, the company is debt-free and has sufficient cash runway for over a year based on current free cash flow. Recent announcements include a share repurchase program aimed at enhancing shareholder value by buying back up to 5 million shares. The management team and board are experienced, with average tenures of 5.3 and 8.3 years respectively. FPX's short-term assets significantly cover both its short- and long-term liabilities, indicating strong financial stability amidst volatility concerns.
- Navigate through the intricacies of FPX Nickel with our comprehensive balance sheet health report here.
- Examine FPX Nickel's past performance report to understand how it has performed in prior years.
Regulus Resources (TSXV:REG)
Simply Wall St Financial Health Rating: ★★★★★★
Overview: Regulus Resources Inc. is a mineral exploration company operating in Canada and Peru with a market cap of CA$463.26 million.
Operations: Regulus Resources Inc. has not reported any revenue segments.
Market Cap: CA$463.26M
Regulus Resources Inc., with a market cap of CA$463.26 million, is pre-revenue and unprofitable but has shown progress by reducing losses at a rate of 14.2% annually over the past five years. The company benefits from having no debt and sufficient cash runway for 1.7 years if free cash flow continues to grow at historical rates. Its short-term assets (CA$9.7M) comfortably exceed liabilities (CA$1.6M), reinforcing financial stability despite its negative return on equity (-6.35%). The seasoned management team and board, with average tenures of 12.5 and 11.3 years respectively, provide experienced leadership in navigating the volatile mining sector landscape.
- Click to explore a detailed breakdown of our findings in Regulus Resources' financial health report.
- Evaluate Regulus Resources' historical performance by accessing our past performance report.
Where To Now?
- Click through to start exploring the rest of the 382 TSX Penny Stocks now.
- Searching for a Fresh Perspective? Diversify your portfolio with solid dividend payers offering reliable income streams to weather potential market turbulence.
This article by Simply Wall St is general in nature. We provide commentary based on historical data and analyst forecasts only using an unbiased methodology and our articles are not intended to be financial advice. It does not constitute a recommendation to buy or sell any stock, and does not take account of your objectives, or your financial situation. We aim to bring you long-term focused analysis driven by fundamental data. Note that our analysis may not factor in the latest price-sensitive company announcements or qualitative material. Simply Wall St has no position in any stocks mentioned.
Have feedback on this article? Concerned about the content? Get in touch with us directly. Alternatively, email editorial-team@simplywallst.com