
 Nasdaq
 華爾街日報
華爾街日報Exploring Three Promising European Stocks with Strong Potential
As the pan-European STOXX Europe 600 Index edges closer to record highs amid positive sentiment about future earnings and economic conditions, investors are increasingly attentive to the potential of small-cap stocks within this dynamic market landscape. In this environment, identifying promising stocks involves looking for companies with solid fundamentals and growth prospects that align well with emerging economic trends.
Top 10 Undiscovered Gems With Strong Fundamentals In Europe
| Name | Debt To Equity | Revenue Growth | Earnings Growth | Health Rating |
|---|---|---|---|---|
| FRoSTA | 5.37% | 4.80% | 13.56% | ★★★★★★ |
| Caisse Régionale de Crédit Agricole Mutuel Brie Picardie Société coopérative | 37.61% | 3.36% | 6.34% | ★★★★★★ |
| Freetrailer Group | 38.17% | 23.13% | 31.09% | ★★★★★☆ |
| Inmocemento | 28.68% | 4.15% | 33.84% | ★★★★★☆ |
| Envirotainer | 43.54% | -23.63% | nan | ★★★★★☆ |
| Inversiones Doalca SOCIMI | 13.10% | 6.72% | 3.11% | ★★★★★☆ |
| Darwin | 3.03% | 50.55% | 46377.71% | ★★★★☆☆ |
| Practic | NA | 4.86% | 6.64% | ★★★★☆☆ |
| MCH Group | 126.04% | 19.05% | 60.90% | ★★★★☆☆ |
| Alantra Partners | 11.36% | -6.39% | -33.69% | ★★★★☆☆ |
Here's a peek at a few of the choices from the screener.
Paul Hartmann (DB:PHH2)
Simply Wall St Value Rating: ★★★★★☆
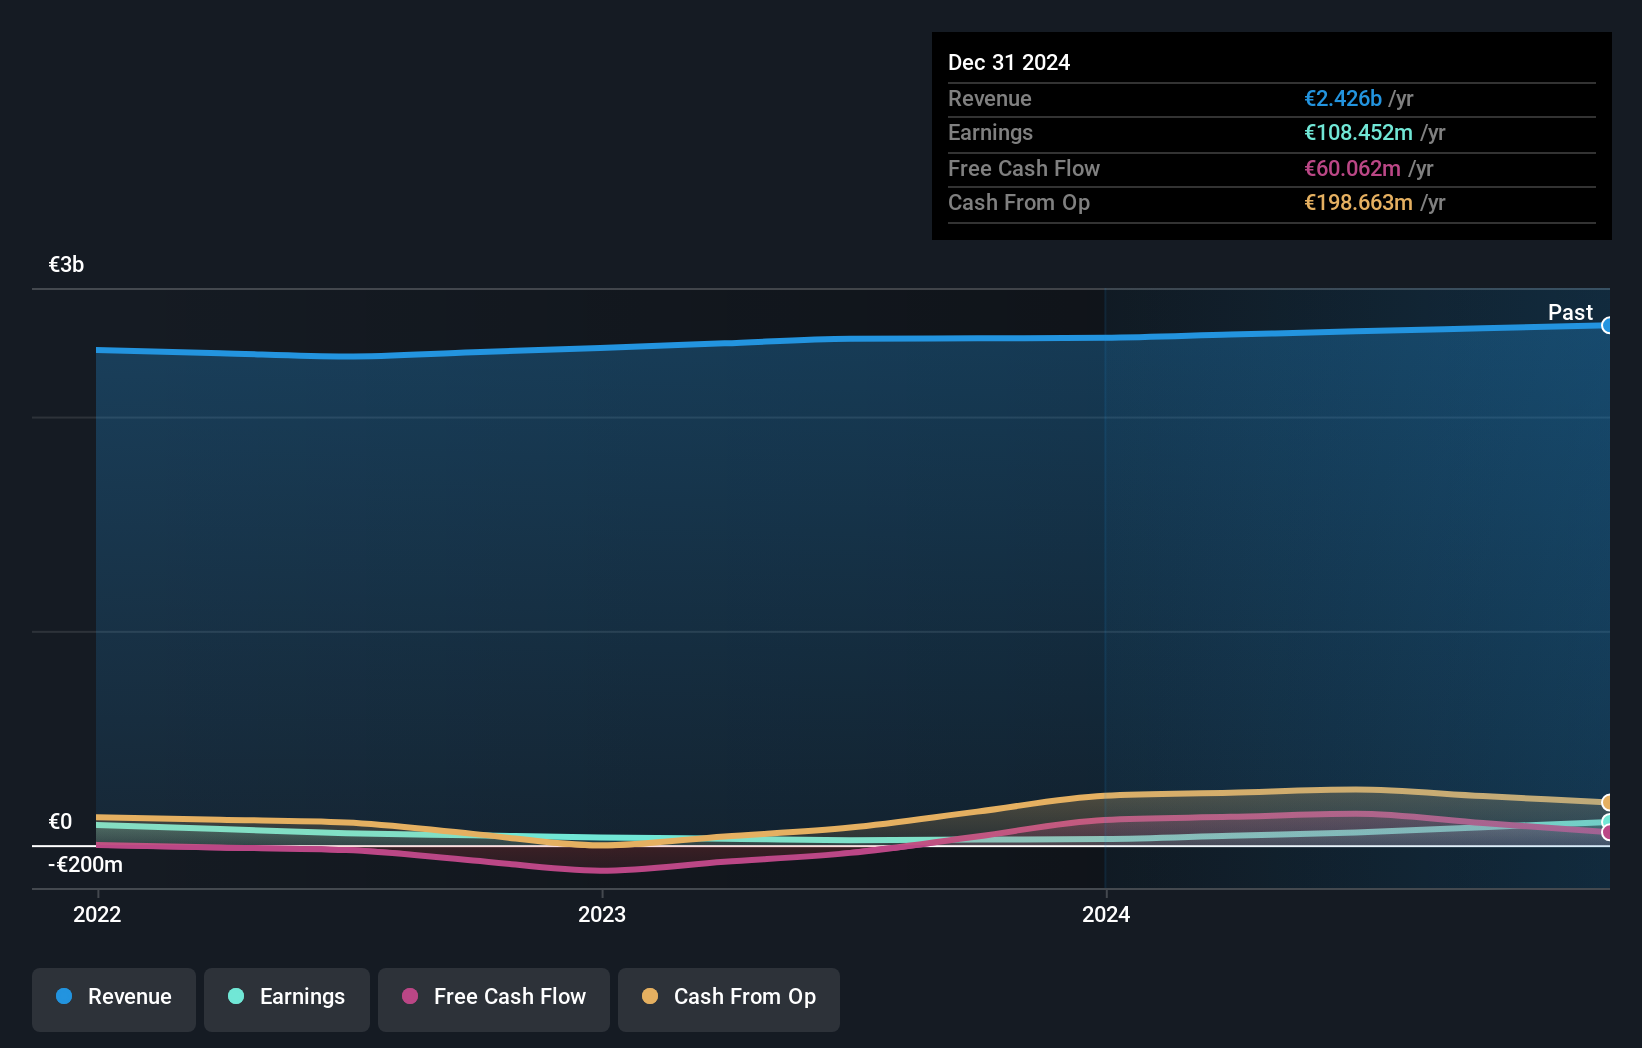
Overview: Paul Hartmann AG is a company that manufactures and sells medical and care products across various regions including Germany, Europe, the Middle East, Africa, Asia-Pacific, and the Americas with a market capitalization of approximately €816.90 million.
Operations: With a market cap of approximately €816.90 million, PHH2 generates revenue primarily from its segments: Incontinence Management (€773.61 million), Wound Care (€619.14 million), Infection Management (€523.34 million), and Complementary divisions (€510.39 million).
With a price-to-earnings ratio of 10x, Paul Hartmann appears undervalued compared to the German market's 18.2x, suggesting potential for value seekers. Despite a challenging five-year period with earnings declining by 9.5% annually, recent performance shows promise as earnings surged by 36.9% last year, outpacing the Medical Equipment industry's growth of 13.1%. The company's interest payments are well covered by EBIT at a robust 7.2 times coverage, indicating solid financial health amidst rising debt-to-equity from 11.1% to 32.7% over five years; however, its net debt to equity remains satisfactory at 19%.
- Dive into the specifics of Paul Hartmann here with our thorough health report.
Evaluate Paul Hartmann's historical performance by accessing our past performance report.
Nolato (OM:NOLA B)
Simply Wall St Value Rating: ★★★★★★
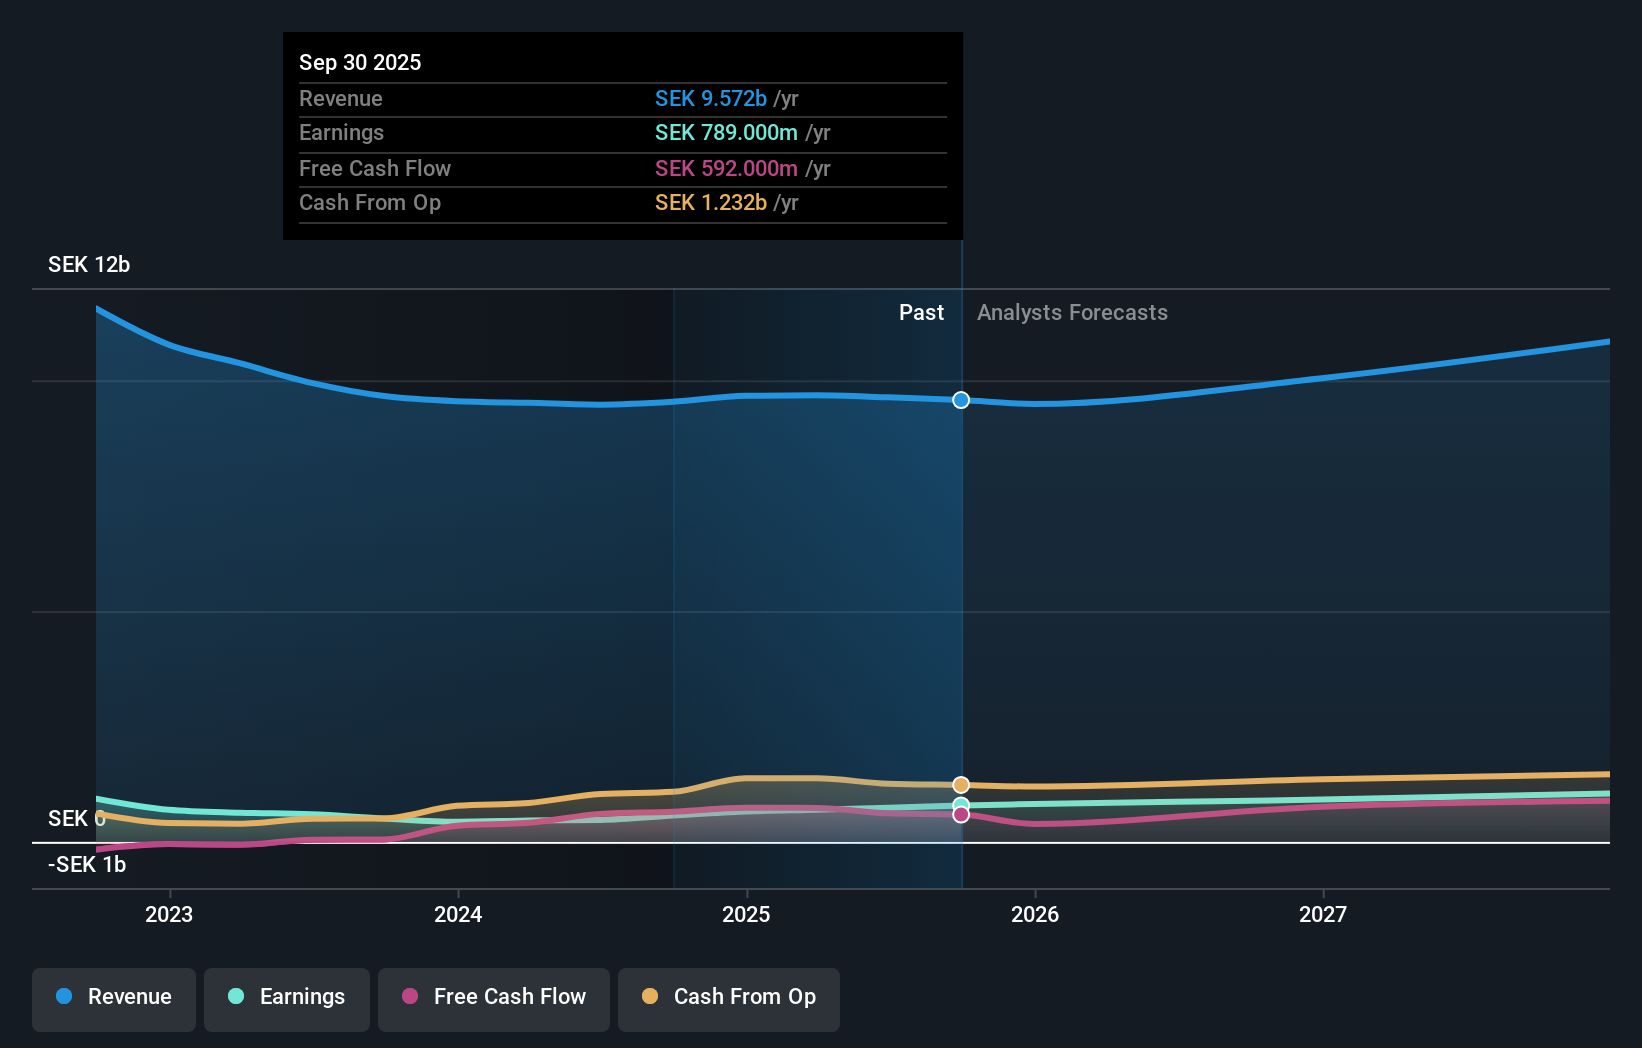
Overview: Nolato AB (publ) is a company that develops, manufactures, and sells plastic, silicone, and thermoplastic elastomer products across Europe, Asia, North America, and internationally with a market cap of approximately SEK16.65 billion.
Operations: Revenue primarily stems from Medical Solutions and Engineered Solutions, contributing SEK5.42 billion and SEK4.17 billion respectively.
Nolato, a promising European player, showcases robust financial health with its interest payments well covered by EBIT at 46.2 times and a satisfactory net debt to equity ratio of 17%. The company has significantly reduced its debt from 54% to 26.7% over the past five years, indicating prudent financial management. Recent earnings highlight growth, with net income rising to SEK 215 million in Q3 from SEK 164 million the previous year, alongside an increase in basic earnings per share to SEK 0.8 from SEK 0.61. Nolato's stock trades at a notable discount of about 35% below estimated fair value, suggesting potential upside for investors seeking value opportunities in this sector.
- Click here and access our complete health analysis report to understand the dynamics of Nolato.
Gain insights into Nolato's historical performance by reviewing our past performance report.
Synsam (OM:SYNSAM)
Simply Wall St Value Rating: ★★★★☆☆
Overview: Synsam AB (publ) operates in the optical retail and eye health sector across the Nordic Region, with a market capitalization of approximately SEK9.65 billion.
Operations: Synsam generates revenue primarily from its operations in Sweden (SEK3.37 billion), Norway (SEK1.36 billion), Denmark (SEK1.16 billion), and Finland (SEK812 million). The company also reports a segment adjustment of SEK-1.32 billion and additional contributions from central functions totaling SEK1.54 billion, which are integral to its financial structure.
Synsam has been making waves with its innovative product launches and strategic expansions. Over the past five years, earnings have grown impressively at 43% annually, although last year's growth of 16% lagged behind the industry average of 27%. The company is trading at a significant discount, about 52% below its estimated fair value. Despite a high net debt to equity ratio of nearly 90%, Synsam's interest payments are well covered by EBIT at over three times coverage. Recent initiatives include expanding their store footprint and enhancing their Smart Glasses offerings, positioning them for continued growth in the Nordic market.
- Get an in-depth perspective on Synsam's performance by reading our health report here.
Explore historical data to track Synsam's performance over time in our Past section.

Turning Ideas Into Actions
- Embark on your investment journey to our 299 European Undiscovered Gems With Strong Fundamentals selection here.
- Already own these companies? Bring clarity to your investment decisions by linking up your portfolio with Simply Wall St, where you can monitor all the vital signs of your stocks effortlessly.
- Elevate your portfolio with Simply Wall St, the ultimate app for investors seeking global market coverage.
Curious About Other Options?
- Explore high-performing small cap companies that haven't yet garnered significant analyst attention.
- Fuel your portfolio with companies showing strong growth potential, backed by optimistic outlooks both from analysts and management.
- Find companies with promising cash flow potential yet trading below their fair value.
This article by Simply Wall St is general in nature. We provide commentary based on historical data and analyst forecasts only using an unbiased methodology and our articles are not intended to be financial advice. It does not constitute a recommendation to buy or sell any stock, and does not take account of your objectives, or your financial situation. We aim to bring you long-term focused analysis driven by fundamental data. Note that our analysis may not factor in the latest price-sensitive company announcements or qualitative material. Simply Wall St has no position in any stocks mentioned.
Have feedback on this article? Concerned about the content? Get in touch with us directly. Alternatively, email editorial-team@simplywallst.com