
 Nasdaq
 華爾街日報
華爾街日報Capital Allocation Trends At Bubbles Intergroup (TLV:BBLS) Aren't Ideal
When we're researching a company, it's sometimes hard to find the warning signs, but there are some financial metrics that can help spot trouble early. Typically, we'll see the trend of both return on capital employed (ROCE) declining and this usually coincides with a decreasing amount of capital employed. This indicates to us that the business is not only shrinking the size of its net assets, but its returns are falling as well. So after glancing at the trends within Bubbles Intergroup (TLV:BBLS), we weren't too hopeful.
What Is Return On Capital Employed (ROCE)?
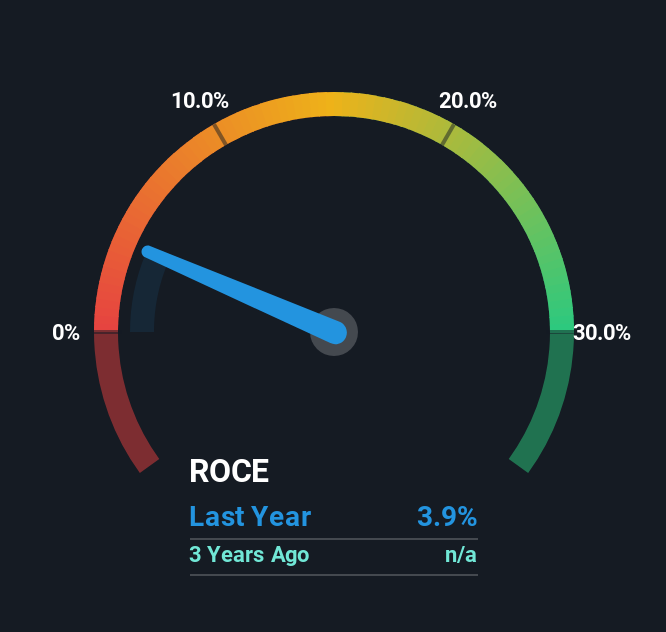
For those who don't know, ROCE is a measure of a company's yearly pre-tax profit (its return), relative to the capital employed in the business. The formula for this calculation on Bubbles Intergroup is:
Return on Capital Employed = Earnings Before Interest and Tax (EBIT) ÷ (Total Assets - Current Liabilities)
0.039 = ₪1.4m ÷ (₪77m - ₪40m) (Based on the trailing twelve months to June 2025).
Therefore, Bubbles Intergroup has an ROCE of 3.9%. In absolute terms, that's a low return and it also under-performs the Software industry average of 12%.
Check out our latest analysis for Bubbles Intergroup
While the past is not representative of the future, it can be helpful to know how a company has performed historically, which is why we have this chart above. If you want to delve into the historical earnings , check out these free graphs detailing revenue and cash flow performance of Bubbles Intergroup.
How Are Returns Trending?
In terms of Bubbles Intergroup's historical ROCE movements, the trend doesn't inspire confidence. To be more specific, the ROCE was 13% two years ago, but since then it has dropped noticeably. On top of that, it's worth noting that the amount of capital employed within the business has remained relatively steady. Since returns are falling and the business has the same amount of assets employed, this can suggest it's a mature business that hasn't had much growth in the last two years. If these trends continue, we wouldn't expect Bubbles Intergroup to turn into a multi-bagger.
On a side note, Bubbles Intergroup's current liabilities are still rather high at 52% of total assets. This can bring about some risks because the company is basically operating with a rather large reliance on its suppliers or other sorts of short-term creditors. While it's not necessarily a bad thing, it can be beneficial if this ratio is lower.
What We Can Learn From Bubbles Intergroup's ROCE
In the end, the trend of lower returns on the same amount of capital isn't typically an indication that we're looking at a growth stock. Unsurprisingly then, the stock has dived 95% over the last five years, so investors are recognizing these changes and don't like the company's prospects. Unless there is a shift to a more positive trajectory in these metrics, we would look elsewhere.
On a separate note, we've found 4 warning signs for Bubbles Intergroup you'll probably want to know about.
While Bubbles Intergroup may not currently earn the highest returns, we've compiled a list of companies that currently earn more than 25% return on equity. Check out this free list here.
Have feedback on this article? Concerned about the content? Get in touch with us directly. Alternatively, email editorial-team (at) simplywallst.com.
This article by Simply Wall St is general in nature. We provide commentary based on historical data and analyst forecasts only using an unbiased methodology and our articles are not intended to be financial advice. It does not constitute a recommendation to buy or sell any stock, and does not take account of your objectives, or your financial situation. We aim to bring you long-term focused analysis driven by fundamental data. Note that our analysis may not factor in the latest price-sensitive company announcements or qualitative material. Simply Wall St has no position in any stocks mentioned.