
 Nasdaq
 華爾街日報
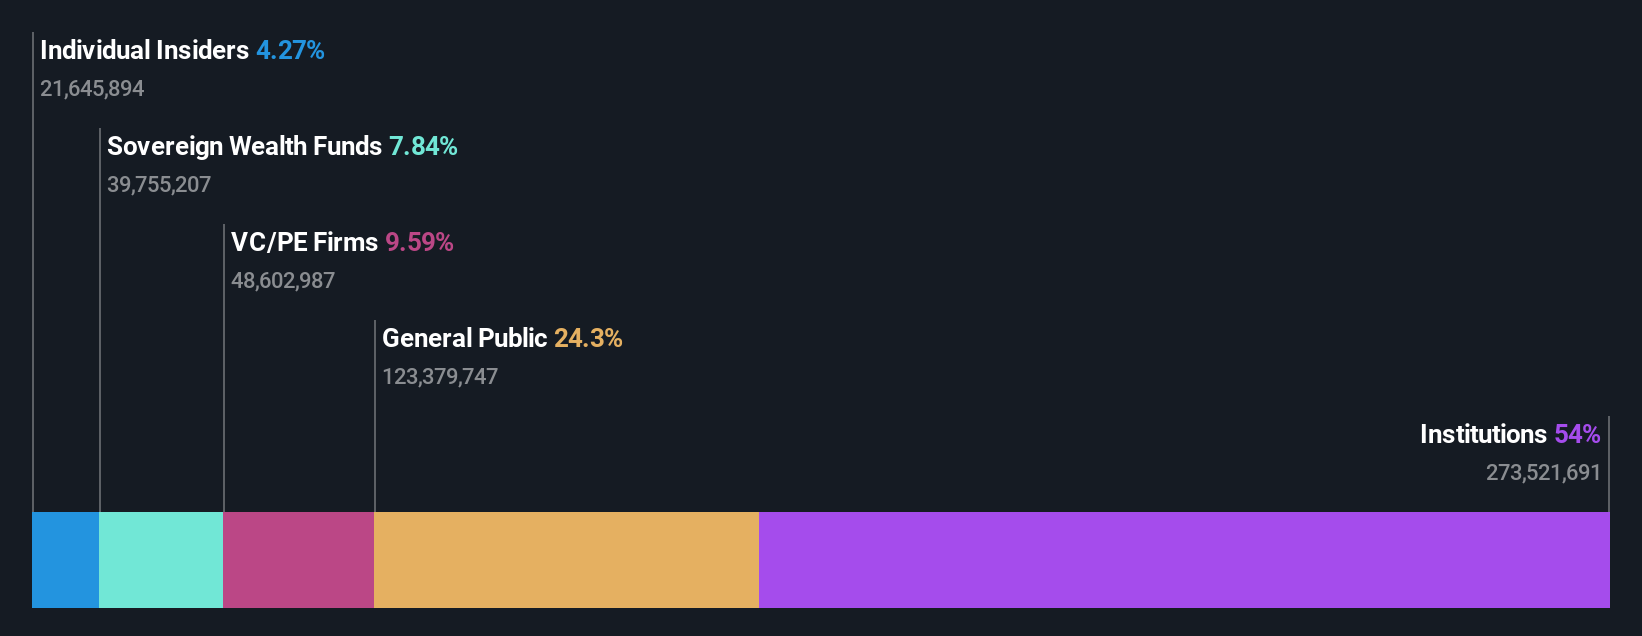
華爾街日報Beijer Ref AB (publ) (STO:BEIJ B) is favoured by institutional owners who hold 54% of the company
Key Insights
- Given the large stake in the stock by institutions, Beijer Ref's stock price might be vulnerable to their trading decisions
- A total of 9 investors have a majority stake in the company with 52% ownership
- Using data from analyst forecasts alongside ownership research, one can better assess the future performance of a company
If you want to know who really controls Beijer Ref AB (publ) (STO:BEIJ B), then you'll have to look at the makeup of its share registry. With 54% stake, institutions possess the maximum shares in the company. That is, the group stands to benefit the most if the stock rises (or lose the most if there is a downturn).
Since institutional have access to huge amounts of capital, their market moves tend to receive a lot of scrutiny by retail or individual investors. Therefore, a good portion of institutional money invested in the company is usually a huge vote of confidence on its future.
Let's delve deeper into each type of owner of Beijer Ref, beginning with the chart below.
View our latest analysis for Beijer Ref
What Does The Institutional Ownership Tell Us About Beijer Ref?
Institutional investors commonly compare their own returns to the returns of a commonly followed index. So they generally do consider buying larger companies that are included in the relevant benchmark index.
We can see that Beijer Ref does have institutional investors; and they hold a good portion of the company's stock. This implies the analysts working for those institutions have looked at the stock and they like it. But just like anyone else, they could be wrong. It is not uncommon to see a big share price drop if two large institutional investors try to sell out of a stock at the same time. So it is worth checking the past earnings trajectory of Beijer Ref, (below). Of course, keep in mind that there are other factors to consider, too.

Investors should note that institutions actually own more than half the company, so they can collectively wield significant power. Beijer Ref is not owned by hedge funds. Eqt Fund Management S.à R.L. is currently the company's largest shareholder with 9.6% of shares outstanding. In comparison, the second and third largest shareholders hold about 7.8% and 7.5% of the stock.
We did some more digging and found that 9 of the top shareholders account for roughly 52% of the register, implying that along with larger shareholders, there are a few smaller shareholders, thereby balancing out each others interests somewhat.
While studying institutional ownership for a company can add value to your research, it is also a good practice to research analyst recommendations to get a deeper understand of a stock's expected performance. There are a reasonable number of analysts covering the stock, so it might be useful to find out their aggregate view on the future.
Insider Ownership Of Beijer Ref
While the precise definition of an insider can be subjective, almost everyone considers board members to be insiders. The company management answer to the board and the latter should represent the interests of shareholders. Notably, sometimes top-level managers are on the board themselves.
Insider ownership is positive when it signals leadership are thinking like the true owners of the company. However, high insider ownership can also give immense power to a small group within the company. This can be negative in some circumstances.
Our most recent data indicates that insiders own some shares in Beijer Ref AB (publ). Insiders own kr3.2b worth of shares (at current prices). Most would say this shows a good alignment of interests between shareholders and the board. Still, it might be worth checking if those insiders have been selling.
General Public Ownership
The general public-- including retail investors -- own 24% stake in the company, and hence can't easily be ignored. This size of ownership, while considerable, may not be enough to change company policy if the decision is not in sync with other large shareholders.
Private Equity Ownership
With an ownership of 9.6%, private equity firms are in a position to play a role in shaping corporate strategy with a focus on value creation. Some might like this, because private equity are sometimes activists who hold management accountable. But other times, private equity is selling out, having taking the company public.
Next Steps:
While it is well worth considering the different groups that own a company, there are other factors that are even more important.
Many find it useful to take an in depth look at how a company has performed in the past. You can access this detailed graph of past earnings, revenue and cash flow.
If you would prefer discover what analysts are predicting in terms of future growth, do not miss this free report on analyst forecasts.
NB: Figures in this article are calculated using data from the last twelve months, which refer to the 12-month period ending on the last date of the month the financial statement is dated. This may not be consistent with full year annual report figures.
Have feedback on this article? Concerned about the content? Get in touch with us directly. Alternatively, email editorial-team (at) simplywallst.com.
This article by Simply Wall St is general in nature. We provide commentary based on historical data and analyst forecasts only using an unbiased methodology and our articles are not intended to be financial advice. It does not constitute a recommendation to buy or sell any stock, and does not take account of your objectives, or your financial situation. We aim to bring you long-term focused analysis driven by fundamental data. Note that our analysis may not factor in the latest price-sensitive company announcements or qualitative material. Simply Wall St has no position in any stocks mentioned.