
 Nasdaq
 華爾街日報
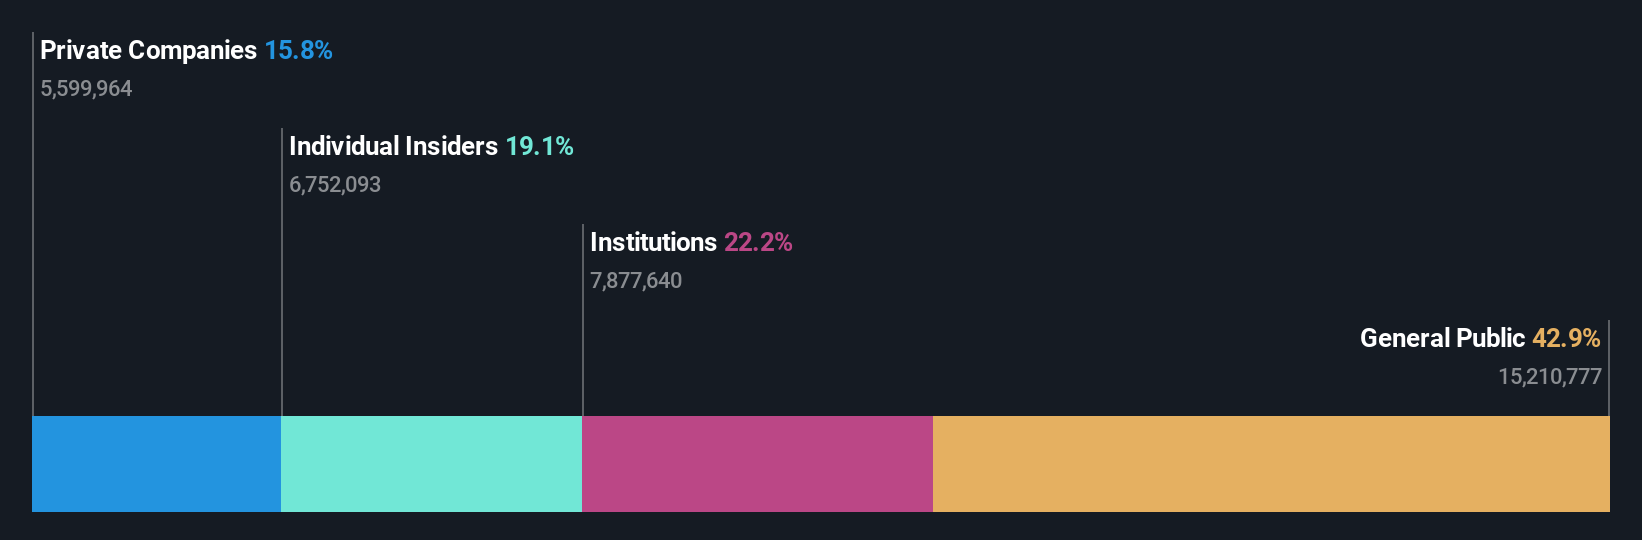
華爾街日報Techwing, Inc. (KOSDAQ:089030) surges 7.6%; retail investors who own 43% shares profited along with institutions
Key Insights
- Techwing's significant retail investors ownership suggests that the key decisions are influenced by shareholders from the larger public
- The top 9 shareholders own 52% of the company
- Insiders own 19% of Techwing
To get a sense of who is truly in control of Techwing, Inc. (KOSDAQ:089030), it is important to understand the ownership structure of the business. With 43% stake, retail investors possess the maximum shares in the company. In other words, the group stands to gain the most (or lose the most) from their investment into the company.
While retail investors were the group that benefitted the most from last week’s ₩110b market cap gain, institutions too had a 22% share in those profits.
Let's take a closer look to see what the different types of shareholders can tell us about Techwing.
View our latest analysis for Techwing
What Does The Institutional Ownership Tell Us About Techwing?
Many institutions measure their performance against an index that approximates the local market. So they usually pay more attention to companies that are included in major indices.
We can see that Techwing does have institutional investors; and they hold a good portion of the company's stock. This can indicate that the company has a certain degree of credibility in the investment community. However, it is best to be wary of relying on the supposed validation that comes with institutional investors. They too, get it wrong sometimes. When multiple institutions own a stock, there's always a risk that they are in a 'crowded trade'. When such a trade goes wrong, multiple parties may compete to sell stock fast. This risk is higher in a company without a history of growth. You can see Techwing's historic earnings and revenue below, but keep in mind there's always more to the story.

Hedge funds don't have many shares in Techwing. The company's CEO Yun-Sung Na is the largest shareholder with 14% of shares outstanding. The second and third largest shareholders are Samsung Asset Management Company, Ltd. and Dasom Tech Co., Ltd., with an equal amount of shares to their name at 5.2%.
We also observed that the top 9 shareholders account for more than half of the share register, with a few smaller shareholders to balance the interests of the larger ones to a certain extent.
While studying institutional ownership for a company can add value to your research, it is also a good practice to research analyst recommendations to get a deeper understand of a stock's expected performance. There is a little analyst coverage of the stock, but not much. So there is room for it to gain more coverage.
Insider Ownership Of Techwing
The definition of an insider can differ slightly between different countries, but members of the board of directors always count. Company management run the business, but the CEO will answer to the board, even if he or she is a member of it.
I generally consider insider ownership to be a good thing. However, on some occasions it makes it more difficult for other shareholders to hold the board accountable for decisions.
Our most recent data indicates that insiders own a reasonable proportion of Techwing, Inc.. Insiders own ₩298b worth of shares in the ₩1.6t company. That's quite meaningful. Most would say this shows a good degree of alignment with shareholders, especially in a company of this size. You can click here to see if those insiders have been buying or selling.
General Public Ownership
The general public-- including retail investors -- own 43% stake in the company, and hence can't easily be ignored. While this group can't necessarily call the shots, it can certainly have a real influence on how the company is run.
Private Company Ownership
We can see that Private Companies own 16%, of the shares on issue. It might be worth looking deeper into this. If related parties, such as insiders, have an interest in one of these private companies, that should be disclosed in the annual report. Private companies may also have a strategic interest in the company.
Next Steps:
While it is well worth considering the different groups that own a company, there are other factors that are even more important. Consider for instance, the ever-present spectre of investment risk. We've identified 1 warning sign with Techwing , and understanding them should be part of your investment process.
If you are like me, you may want to think about whether this company will grow or shrink. Luckily, you can check this free report showing analyst forecasts for its future.
NB: Figures in this article are calculated using data from the last twelve months, which refer to the 12-month period ending on the last date of the month the financial statement is dated. This may not be consistent with full year annual report figures.
Have feedback on this article? Concerned about the content? Get in touch with us directly. Alternatively, email editorial-team (at) simplywallst.com.
This article by Simply Wall St is general in nature. We provide commentary based on historical data and analyst forecasts only using an unbiased methodology and our articles are not intended to be financial advice. It does not constitute a recommendation to buy or sell any stock, and does not take account of your objectives, or your financial situation. We aim to bring you long-term focused analysis driven by fundamental data. Note that our analysis may not factor in the latest price-sensitive company announcements or qualitative material. Simply Wall St has no position in any stocks mentioned.