
 Nasdaq
 華爾街日報
華爾街日報Evergy (EVRG) Stock’s Recent Momentum: Is the Utility Now Trading Below Its Underlying Value?
Evergy stock performance and recent momentum
Evergy (EVRG) has quietly outperformed many utilities this year, with the stock up about 18% year to date and roughly 23% over the past year, even after a softer past month.
See our latest analysis for Evergy.
That mix of a softer 1 month share price return and a strong year to date share price return, alongside a 1 year total shareholder return of about 23 percent, suggests investors are gradually warming to Evergy as earnings and cash flows look more dependable.
If Evergy’s steadier profile appeals to you, it could be worth exploring other utilities with solid balance sheets and fundamentals via this solid balance sheet and fundamentals stocks screener (None results).
With shares still trading at a mid teens discount to analyst targets, but showing healthy earnings and dividend support, is Evergy quietly undervalued today, or is the market already pricing in its next leg of regulated growth?
Most Popular Narrative Narrative: 12.7% Undervalued
With Evergy last closing at $73.01 against a narrative fair value near the mid $80s, the story hinges on how far growth and margins can stretch.
Accelerated investment in grid modernization, new natural gas, and solar generation, enabled by supportive state regulatory approvals and legislative mechanisms (e.g., PISA, CWIP), positions Evergy to efficiently deploy and recover capital, benefitting future net margins and regulated earnings.
Curious how modest revenue growth, fatter margins, and a lower future earnings multiple can still add up to a higher fair value? Unpack the narrative math behind that gap.
Result: Fair Value of $83.59 (UNDERVALUED)
Have a read of the narrative in full and understand what's behind the forecasts.
However, significant equity funding needs and heavy reliance on a few mega projects mean that slower load growth or tougher markets could quickly cap that upside.
Find out about the key risks to this Evergy narrative.
Another Way to Look at Value
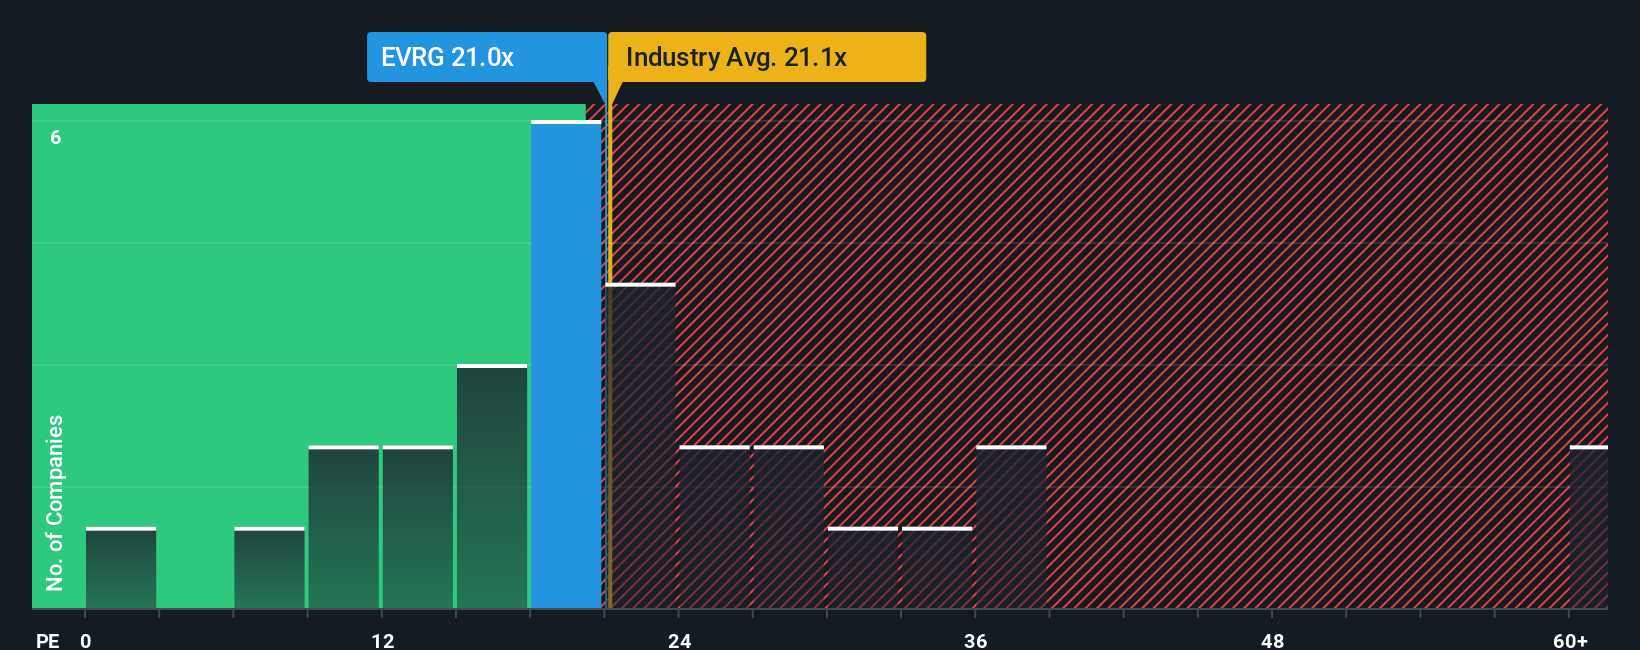
While the narrative framework points to upside, a simple price to earnings cross check is more cautious. Evergy trades at about 19.8 times earnings, slightly richer than both peers at 17.7 times and the US utilities average at 19.5 times, yet still below a fair ratio of 22.4 times.
That leaves a narrow margin of safety, suggesting more of a steady compounder than a screaming bargain. It also raises a simple question for investors: is this premium enough to justify the risks around funding, regulation, and execution?
See what the numbers say about this price — find out in our valuation breakdown.
Build Your Own Evergy Narrative
If you see the story differently or want to dig into the numbers yourself, you can build a personalized view in just a few minutes: Do it your way.
A great starting point for your Evergy research is our analysis highlighting 1 key reward and 2 important warning signs that could impact your investment decision.
Looking for more investment ideas?
If you stop at Evergy, you could miss some of the market’s most compelling setups, so use the Simply Wall St Screener to uncover your next move.
- Capture potential mispricing by targeting companies trading below intrinsic value through these 901 undervalued stocks based on cash flows with strong cash flow support and upside potential.
- Position yourself early in transformative technology trends by scanning these 24 AI penny stocks that are building real businesses around artificial intelligence, not just hype.
- Strengthen your income strategy by focusing on reliable payers using these 10 dividend stocks with yields > 3% that aim to deliver yields above 3 percent with sustainable payout ratios.
This article by Simply Wall St is general in nature. We provide commentary based on historical data and analyst forecasts only using an unbiased methodology and our articles are not intended to be financial advice. It does not constitute a recommendation to buy or sell any stock, and does not take account of your objectives, or your financial situation. We aim to bring you long-term focused analysis driven by fundamental data. Note that our analysis may not factor in the latest price-sensitive company announcements or qualitative material. Simply Wall St has no position in any stocks mentioned.
Have feedback on this article? Concerned about the content? Get in touch with us directly. Alternatively, email editorial-team@simplywallst.com