
 Nasdaq
 華爾街日報
華爾街日報StoneX Group (SNEX) Valuation Check After New Digital Asset Treasury Partnership with Caliber
Caliber’s decision to tap StoneX Group (SNEX) as an institutional trading and custody partner for its Digital Asset Treasury strategy puts StoneX squarely in the path of growing institutional demand around blockchain linked reserves.
See our latest analysis for StoneX Group.
That backdrop helps explain why investors have been steadily re-rating StoneX, with the share price now at $98.07 and a strong year to date share price return of 46.8 percent, alongside a robust 5 year total shareholder return of 285.23 percent. This combination signals that momentum is still very much intact.
If Caliber’s move has you thinking about who else is executing on niche financial themes, it might be worth scanning fast growing stocks with high insider ownership for other under the radar compounders.
With StoneX now trading just shy of analyst targets after a powerful multi year run, the real question is whether the market is underestimating its earnings power or already pricing in the next leg of growth.
Price-to-Earnings of 17.3x: Is it justified?
On a headline basis, StoneX's 17.3x price to earnings multiple at a 98.07 dollar share price points to a market that is paying up for its profits.
The price to earnings ratio compares what investors pay today to each dollar of current earnings. This is a core yardstick for capital markets firms whose businesses translate directly into bottom line profit cycles. For StoneX, steady earnings growth and a long operating history help explain why investors are comfortable assigning a premium tag.
However, that premium is not without limits. The stock is flagged as expensive versus both a peer average of 16.8x and an estimated fair price to earnings ratio of 16.1x. This suggests expectations for future profit expansion may already be generously embedded. If the market gravity of that fair ratio reasserts itself, the multiple has room to compress even if earnings continue to grow.
At the same time, StoneX still looks more affordable than the broader US Capital Markets industry, where the average price to earnings ratio sits at a much richer 25.6x. This underscores that investors are rewarding its track record but not yet treating it like a high flying outlier.
Explore the SWS fair ratio for StoneX Group
Result: Price-to-Earnings of 17.3x (ABOUT RIGHT)
However, softer trading volumes or a sharper pullback in risk appetite could quickly pressure StoneX’s fee income and test the market’s optimistic earnings assumptions.
Find out about the key risks to this StoneX Group narrative.
Another View: DCF Flags a Very Different Story
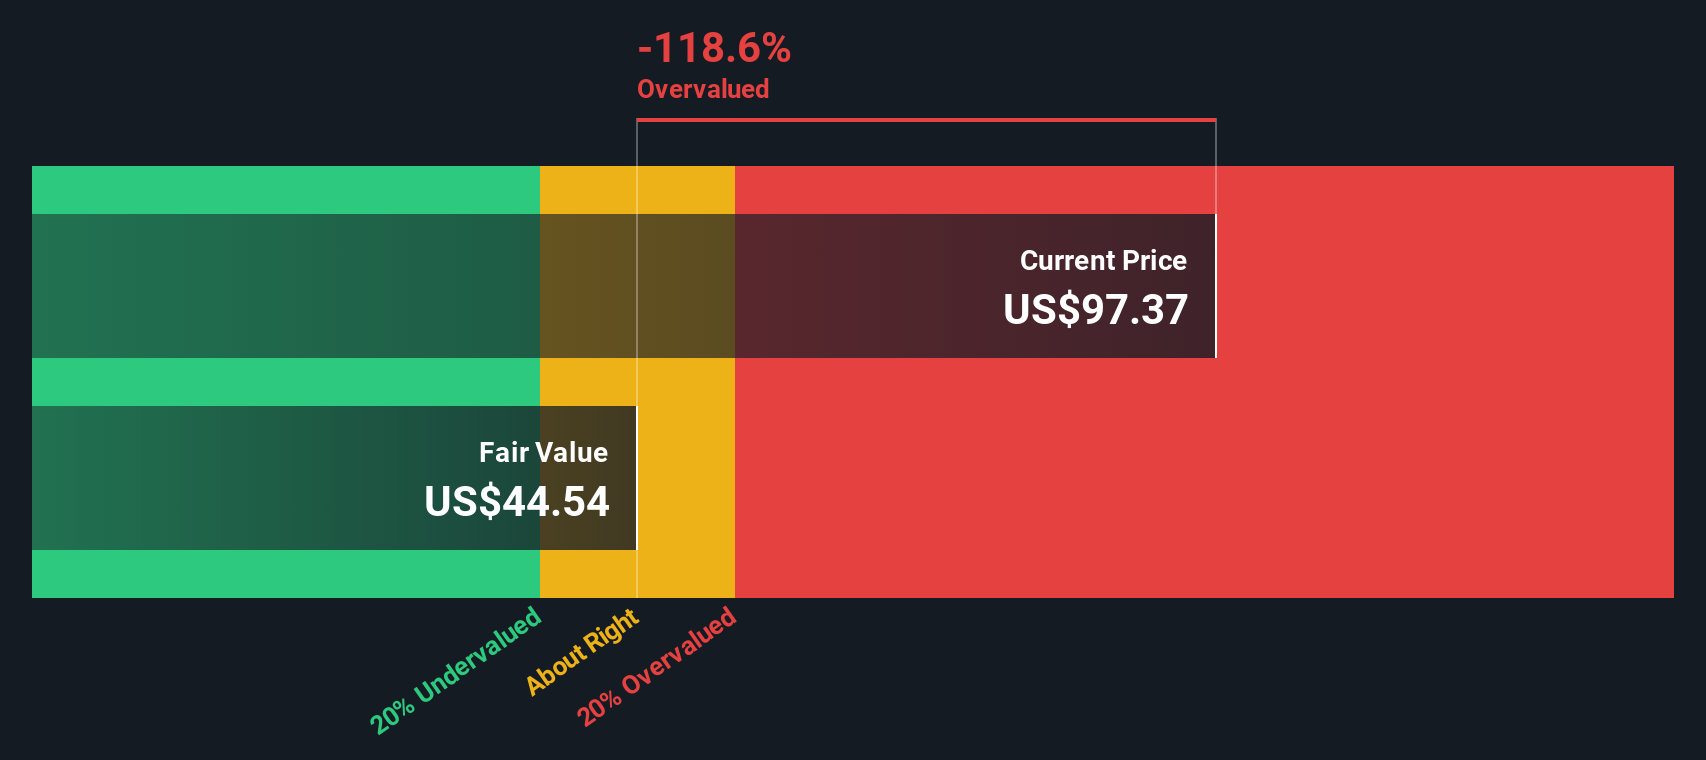
While the 17.3x earnings multiple suggests StoneX is only slightly expensive, our DCF model is far harsher. It puts fair value at 43.7 dollars versus a 98.07 dollar share price, implying the stock is materially overvalued. Is the market right, or is this optimism running too far ahead of fundamentals?
Look into how the SWS DCF model arrives at its fair value.
Simply Wall St performs a discounted cash flow (DCF) on every stock in the world every day (check out StoneX Group for example). We show the entire calculation in full. You can track the result in your watchlist or portfolio and be alerted when this changes, or use our stock screener to discover 901 undervalued stocks based on their cash flows. If you save a screener we even alert you when new companies match - so you never miss a potential opportunity.
Build Your Own StoneX Group Narrative
If you see the numbers differently, or would rather follow your own process, you can quickly shape a personalized view in just a few minutes: Do it your way.
A great starting point for your StoneX Group research is our analysis highlighting 3 key rewards and 1 important warning sign that could impact your investment decision.
Ready for more actionable investment ideas?
Before you move on, consider using the Simply Wall St Screener to search for quality businesses that align with your strategy.
- Focus on consistent cash generators by scanning these 10 dividend stocks with yields > 3% that can potentially strengthen your portfolio with reliable income streams.
- Look for possible mispriced opportunities by reviewing these 901 undervalued stocks based on cash flows where the market may not yet reflect long term cash flow potential.
- Track structural shifts in the market by following these 24 AI penny stocks that could benefit from the adoption of artificial intelligence across industries.
This article by Simply Wall St is general in nature. We provide commentary based on historical data and analyst forecasts only using an unbiased methodology and our articles are not intended to be financial advice. It does not constitute a recommendation to buy or sell any stock, and does not take account of your objectives, or your financial situation. We aim to bring you long-term focused analysis driven by fundamental data. Note that our analysis may not factor in the latest price-sensitive company announcements or qualitative material. Simply Wall St has no position in any stocks mentioned.
Have feedback on this article? Concerned about the content? Get in touch with us directly. Alternatively, email editorial-team@simplywallst.com