
 Nasdaq
 華爾街日報
華爾街日報Is Walmart Still Attractive After Its Strong 2025 Run And E Commerce Expansion?
- If you are wondering whether Walmart is still a bargain after its huge run, or if most of the upside is already priced in, this article unpacks what the current share price really implies about future returns.
- Despite some recent volatility, with the stock down 3.5% over the last week, Walmart is still up 7.3% over 30 days, 24.0% year to date, 21.6% over the past year, and 145.8% and 148.6% over the last 3 and 5 years respectively. This pattern hints at both long term strength and shifting risk perceptions.
- Recent headlines have focused on Walmart doubling down on e commerce and automation initiatives, expanding its marketplace, and pushing deeper into higher margin areas like advertising and healthcare services. These moves help explain why investors have been willing to pay more for the stock, as they potentially reshape Walmart's growth profile beyond traditional brick and mortar retail.
- Right now, Walmart only scores a 1 out of 6 on our valuation checks. On the surface it does not look like a classic deep value play, but as we walk through different valuation approaches and, later, a more holistic way to think about fair value, you will see there is more to the story than a single score suggests.
Walmart scores just 1/6 on our valuation checks. See what other red flags we found in the full valuation breakdown.
Approach 1: Walmart Discounted Cash Flow (DCF) Analysis
A Discounted Cash Flow model estimates what a business is worth today by projecting the cash it can generate in the future and then discounting those cash flows back to the present.
For Walmart, the model starts with last twelve month Free Cash Flow of about $17.3 billion and projects how this could grow as the company scales its e commerce, marketplace, and higher margin services. Analyst forecasts and Simply Wall St extrapolations suggest Free Cash Flow could rise to roughly $50.3 billion by 2035, with interim projections like $32.4 billion by 2030 in dollar terms.
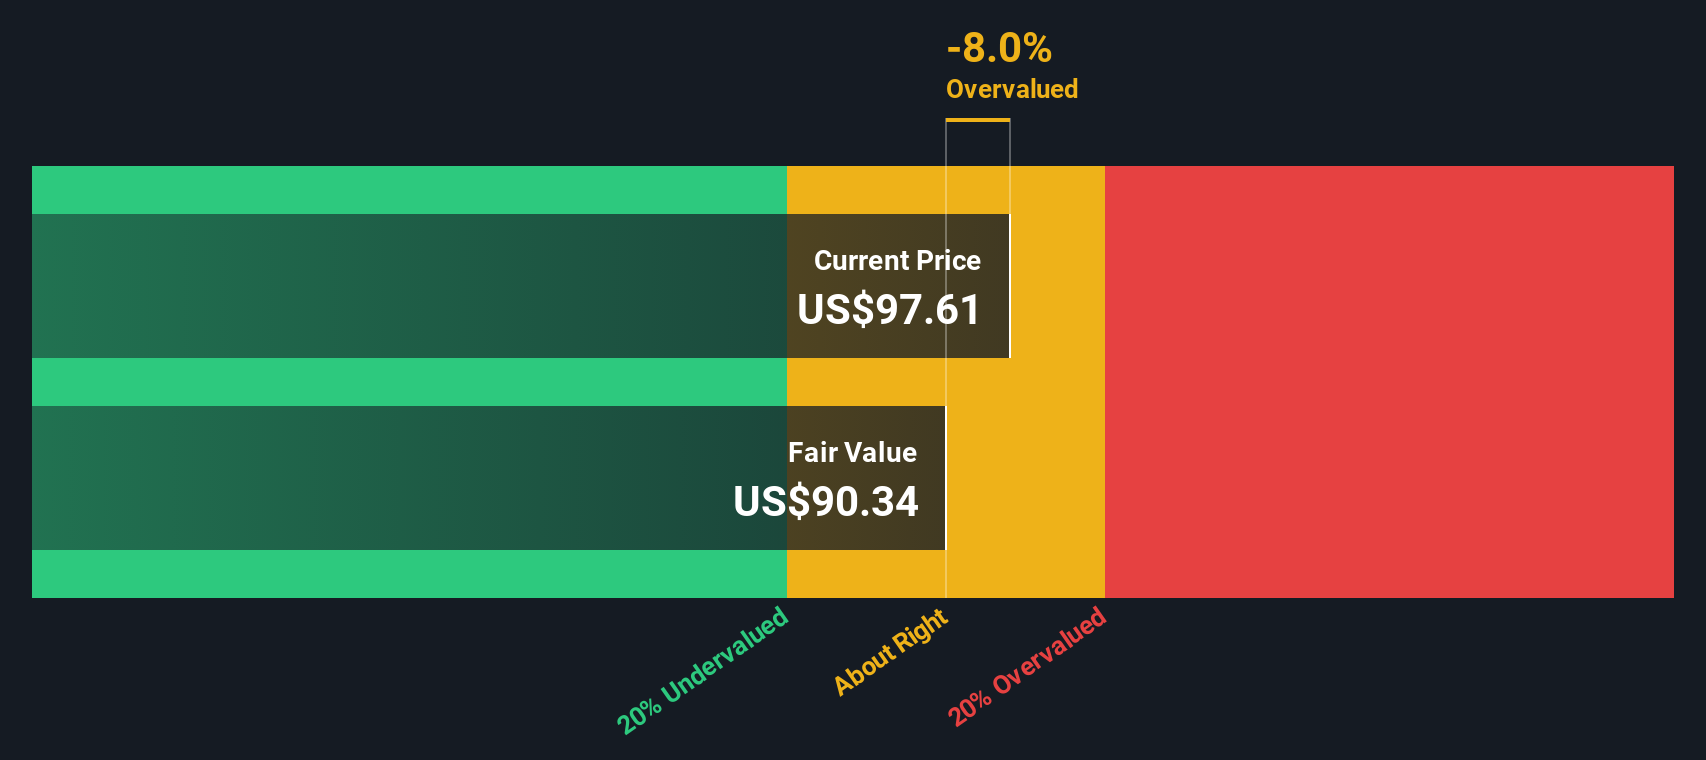
Aggregating and discounting these projected cash flows using a 2 Stage Free Cash Flow to Equity framework gives an estimated intrinsic value of $116.15 per share. Compared with the current share price, this implies the stock is around 3.9% undervalued, which sits within a reasonable margin of error rather than signaling a deep bargain.
In other words, the DCF view suggests Walmart is trading close to its calculated fair value, with only a modest upside implied by this model.
Result: ABOUT RIGHT
Walmart is fairly valued according to our Discounted Cash Flow (DCF), but this can change at a moment's notice. Track the value in your watchlist or portfolio and be alerted on when to act.
Approach 2: Walmart Price vs Earnings
For a mature, consistently profitable business like Walmart, the price to earnings, or PE, ratio is a practical way to gauge what investors are willing to pay for each dollar of current earnings. In general, faster growth and lower risk justify a higher PE, while slower growth and higher uncertainty point to a lower, more conservative multiple.
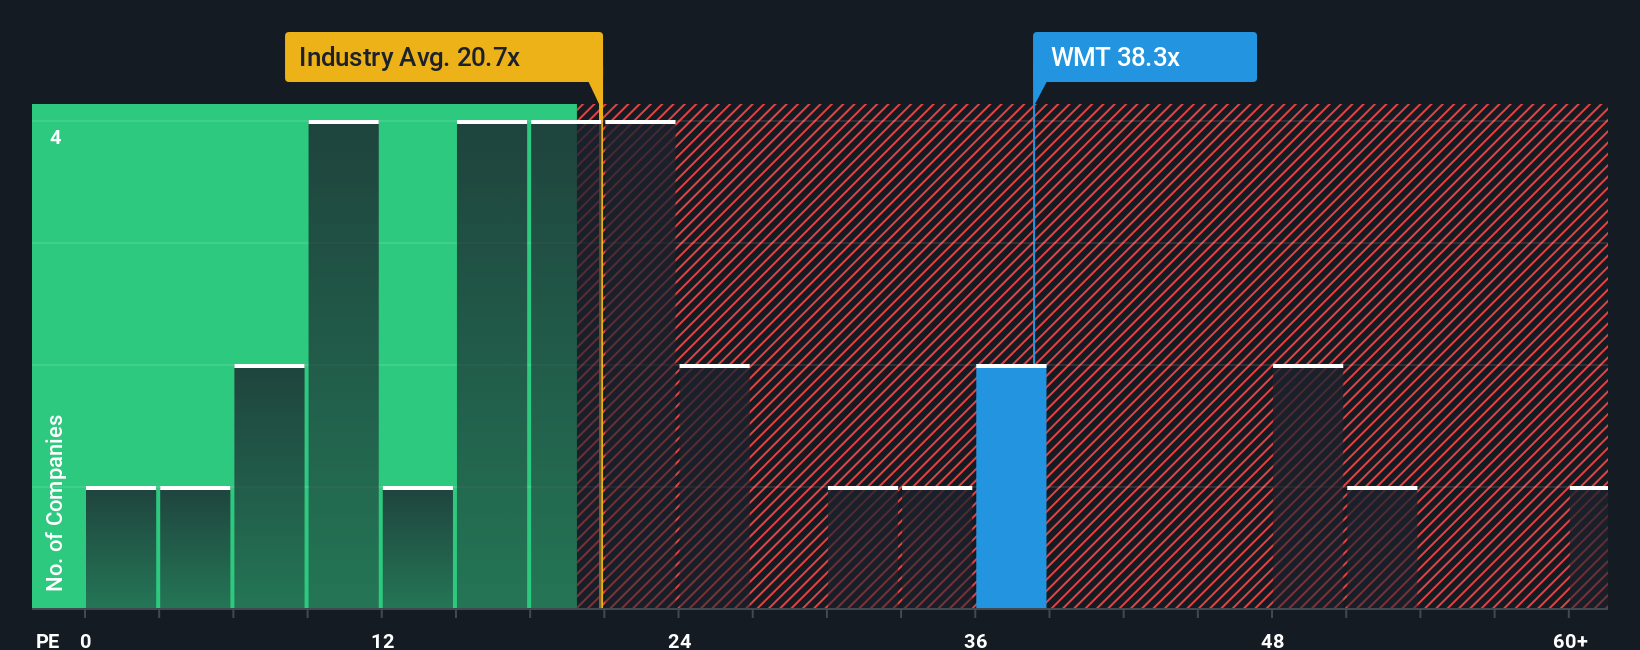
Walmart currently trades on about 38.8x earnings, which is well above both the Consumer Retailing industry average of roughly 21.8x and a peer group average near 25.8x. On the surface that premium might look stretched. However, Simply Wall St uses a proprietary Fair Ratio estimate of 36.8x, which reflects Walmart’s specific earnings growth outlook, scale, industry positioning, margins, and risk profile.
This Fair Ratio is more informative than a simple comparison with peers or the industry, because it adjusts for what actually makes Walmart different rather than assuming all retailers deserve the same multiple. Set against the current 38.8x PE, the Fair Ratio of 36.8x implies Walmart is trading at a modest premium, suggesting the stock looks slightly overvalued on this metric.
Result: OVERVALUED
PE ratios tell one story, but what if the real opportunity lies elsewhere? Discover 1459 companies where insiders are betting big on explosive growth.
Upgrade Your Decision Making: Choose your Walmart Narrative
Earlier we mentioned that there is an even better way to understand valuation, so let us introduce you to Narratives. This is a simple framework on Simply Wall St’s Community page where you attach your story about Walmart’s future to concrete numbers like revenue, earnings, and margins. You then link that story to a financial forecast and a Fair Value, and compare that Fair Value with today’s share price to decide whether to buy, hold, or sell. The system keeps updating your Narrative dynamically as new earnings or news arrive. One investor might build a bullish Walmart Narrative around sustained omni channel growth, rising margins, and a Fair Value closer to the higher analyst target near $127. Another might anchor a more cautious Narrative on slower growth, margin pressure, and a Fair Value closer to the low end near $64. Both can instantly see how their differing assumptions translate into very different opportunities and risks.
Do you think there's more to the story for Walmart? Head over to our Community to see what others are saying!
This article by Simply Wall St is general in nature. We provide commentary based on historical data and analyst forecasts only using an unbiased methodology and our articles are not intended to be financial advice. It does not constitute a recommendation to buy or sell any stock, and does not take account of your objectives, or your financial situation. We aim to bring you long-term focused analysis driven by fundamental data. Note that our analysis may not factor in the latest price-sensitive company announcements or qualitative material. Simply Wall St has no position in any stocks mentioned.
Have feedback on this article? Concerned about the content? Get in touch with us directly. Alternatively, email editorial-team@simplywallst.com