
 Nasdaq
 華爾街日報
華爾街日報Does PayPal Around $60 Offer Value After 2025 Profitability Expectations Shift?
- If you have been wondering whether PayPal Holdings at around $60 a share is a bargain or a value trap, you are not alone. This breakdown is designed to give you a clear, no-jargon view of where it truly stands.
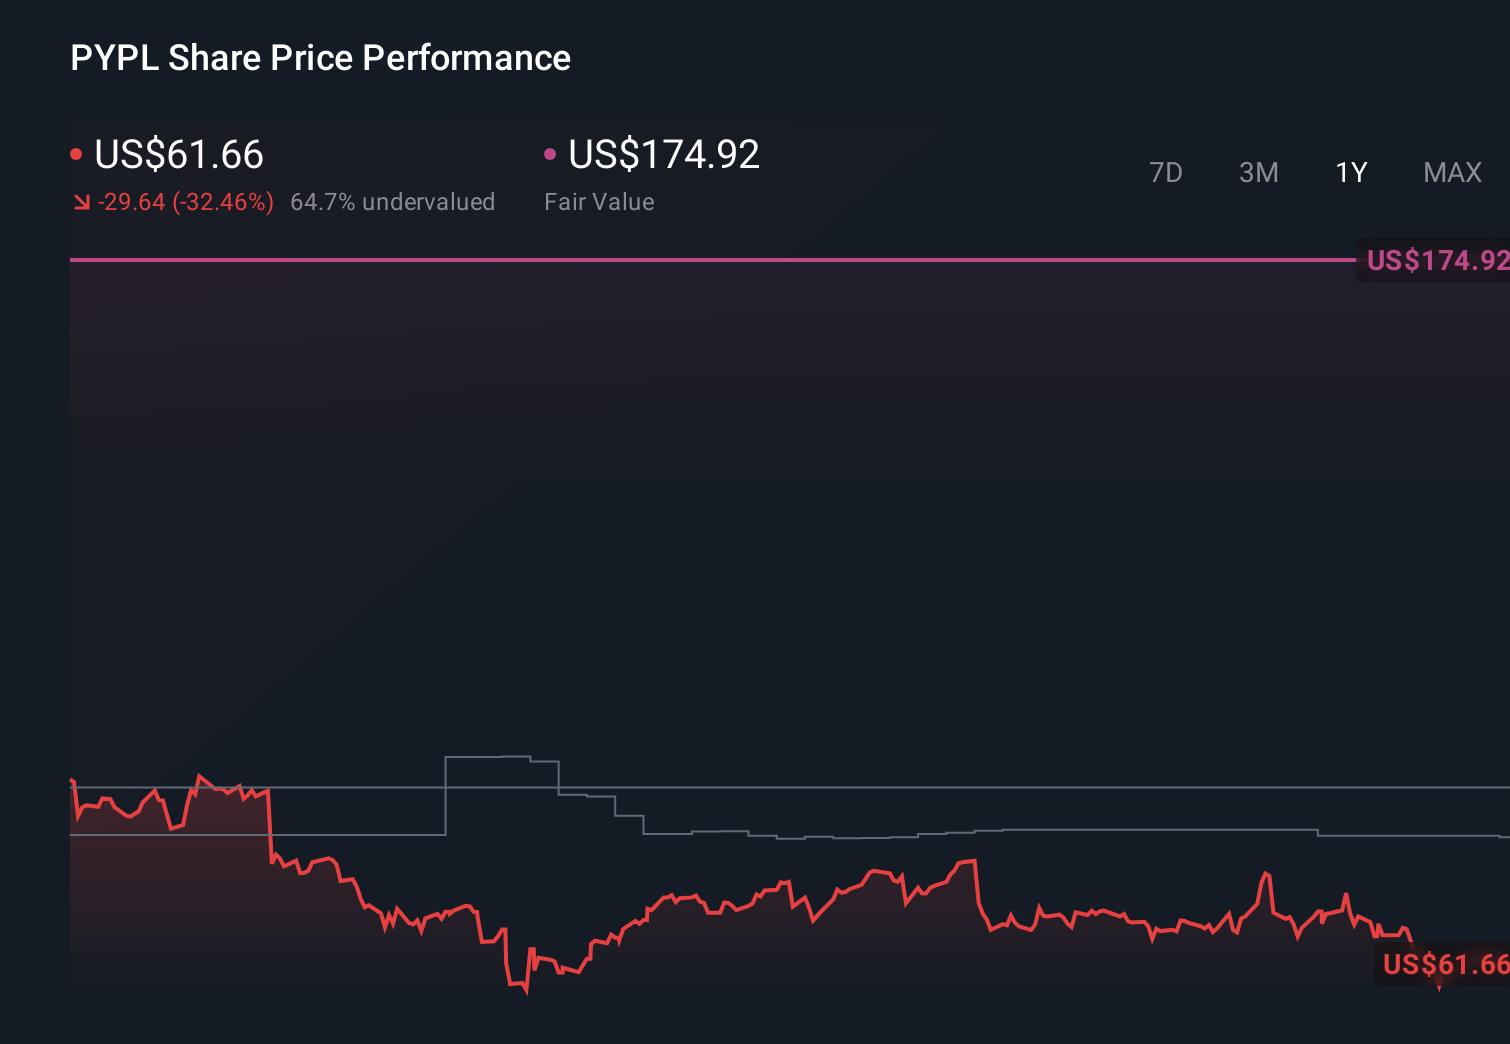
- The stock has inched up about 1.0% over the last week even as it remains down roughly 30.3% year to date and 31.7% over the past year. This combination often signals shifting market expectations about both growth and risk.
- Recently, the focus around PayPal has centered on its push to streamline costs, refocus on higher quality transaction volume, and sharpen its competitive edge against newer fintech players. At the same time, ongoing headlines about digital payment adoption, online shopping trends, and tighter consumer spending have framed the narrative around how much growth the market is willing to pay for.
- Despite that volatility, PayPal currently scores a solid 5/6 on our valuation checks, suggesting the market may be underestimating it on several fronts. In the next sections we will walk through those valuation methods, before finishing with an intuitive way to think about what the stock may be worth.
Find out why PayPal Holdings's -31.7% return over the last year is lagging behind its peers.
Approach 1: PayPal Holdings Excess Returns Analysis
The Excess Returns model asks a simple question: does PayPal earn enough on shareholders’ capital, after its cost of equity, to create meaningful long-term value, and how much is that stream of excess profit worth today?
For PayPal, the starting point is its Book Value of $21.46 per share and a Stable Book Value estimate of $25.18 per share, based on forecasts from 8 analysts. On that equity base, analysts expect a Stable EPS of $6.19 per share, implying an Average Return on Equity of 24.58%, comfortably above the estimated Cost of Equity of $1.96 per share.
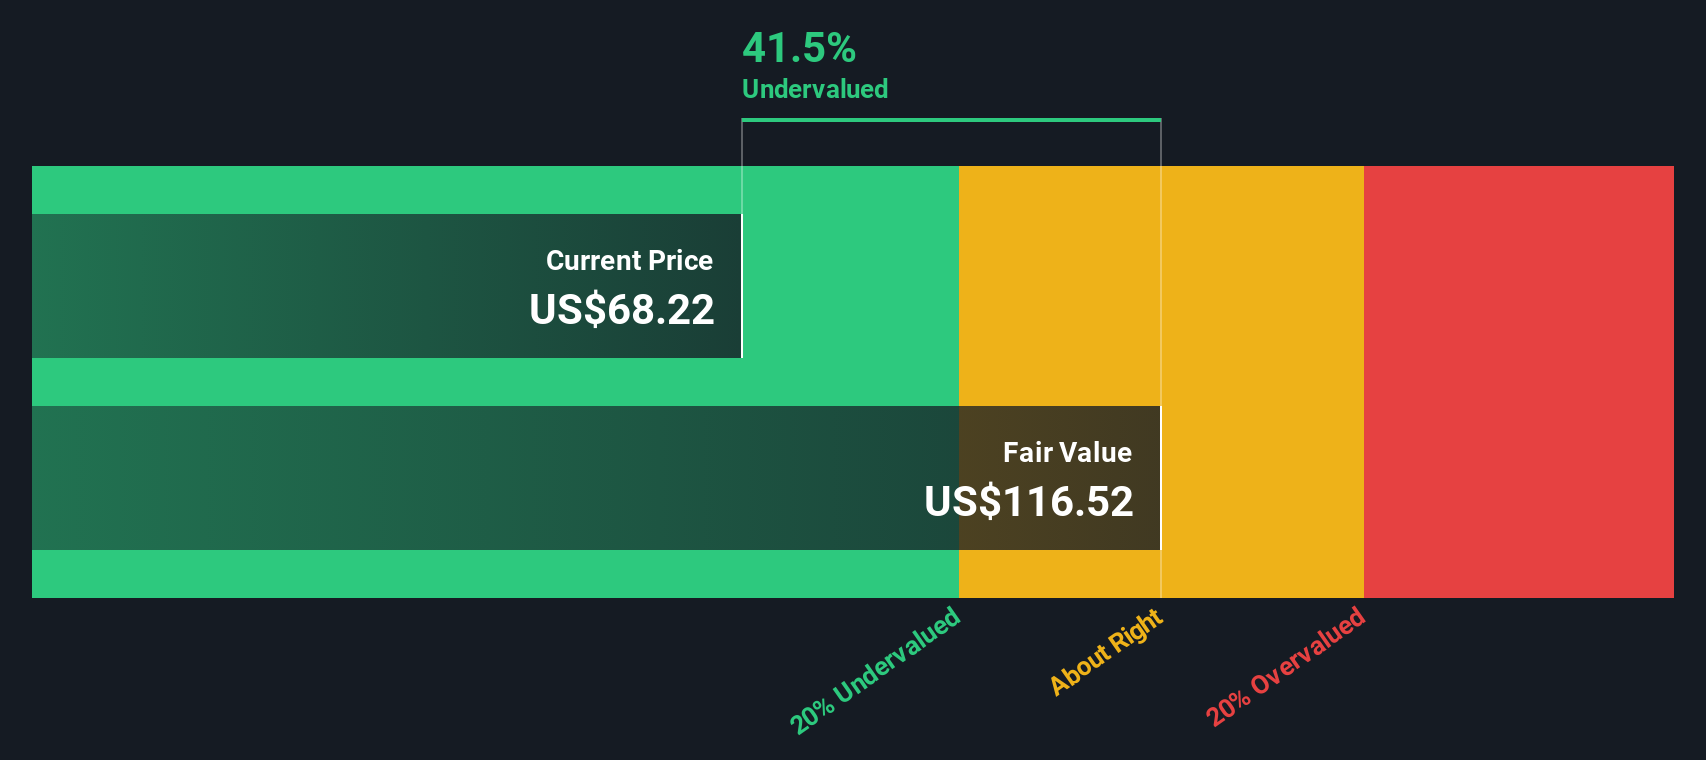
The gap between what PayPal earns and what investors require is captured in an Excess Return of $4.23 per share. When those excess returns are projected forward and capitalized, the model arrives at an intrinsic value of about $119 per share. With the stock trading near $60, the implied 49.6% discount suggests the market is pricing in a sharp deterioration in profitability that is not currently reflected in analyst expectations.
Result: UNDERVALUED
Our Excess Returns analysis suggests PayPal Holdings is undervalued by 49.6%. Track this in your watchlist or portfolio, or discover 901 more undervalued stocks based on cash flows.
Approach 2: PayPal Holdings Price vs Earnings
For a consistently profitable business like PayPal, the Price to Earnings, or PE, ratio is a useful shortcut for what investors are paying today for each dollar of current profits. It ties directly to earnings, which ultimately fund buybacks, reinvestment, or potential future dividends.
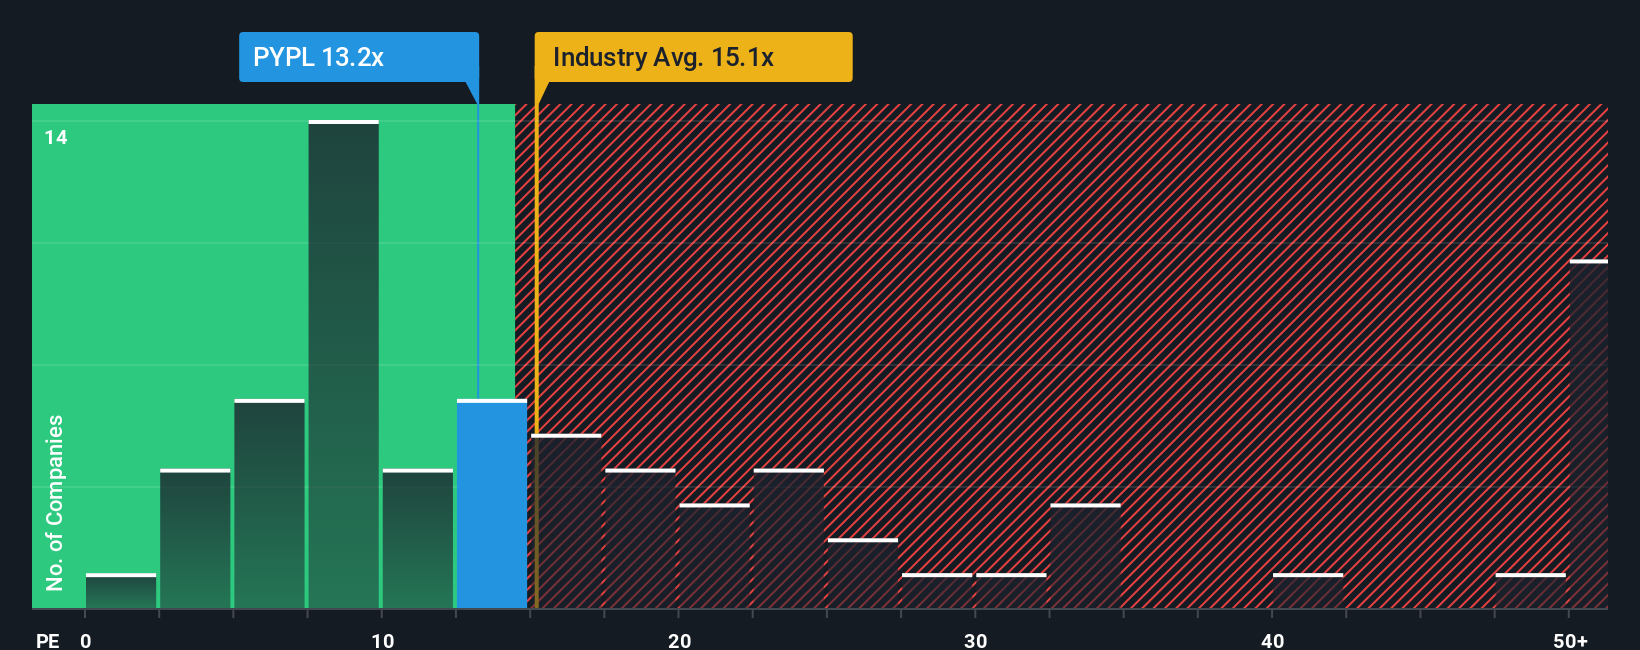
In practice, a higher PE is usually reserved for companies with stronger growth prospects and lower perceived risk, while slower growing or more volatile businesses tend to trade on lower multiples. PayPal currently trades on a PE of about 11.4x, which sits below both the diversified financial industry average of roughly 13.9x and the broader peer group average of around 60.1x.
Simply Wall St’s Fair Ratio framework goes a step further by asking what PE multiple would be reasonable for PayPal specifically, given its earnings growth outlook, margin profile, market cap, industry, and risk factors. On that basis, PayPal’s Fair PE Ratio is estimated at about 17.8x, a level that reflects stronger fundamentals than the headline industry average would suggest. Because this Fair Ratio is meaningfully above the current 11.4x multiple, the model points to the shares looking undervalued on an earnings basis.
Result: UNDERVALUED
PE ratios tell one story, but what if the real opportunity lies elsewhere? Discover 1459 companies where insiders are betting big on explosive growth.
Upgrade Your Decision Making: Choose your PayPal Holdings Narrative
Earlier we mentioned that there is an even better way to understand valuation, so let us introduce you to Narratives, a simple way to connect your view of a company’s story with the numbers behind its future revenue, earnings, margins, and ultimately fair value.
A Narrative on Simply Wall St is your own investment storyline for a company, where you spell out what you believe will drive the business, link that to a concrete financial forecast, and then see what fair value those assumptions imply.
Because each Narrative converts a story into projected cash flows and a fair value estimate, it becomes an easy, visual tool for comparing your Fair Value for PayPal with its current share price and deciding whether that difference supports a change in your portfolio.
These Narratives live inside the Simply Wall St Community page, are used by millions of investors, and update dynamically as new earnings reports, news, or guidance changes flow in. This means your fair value view can evolve with the latest information rather than going stale between reports.
For example, one PayPal Narrative on the Community might assume faster AI driven commerce growth, higher margins, and a fair value near $190. Another might assume slower growth and more competitive pressure with a fair value closer to $90. Together, these show how different but clearly defined perspectives can coexist and guide very different portfolio decisions.
Do you think there's more to the story for PayPal Holdings? Head over to our Community to see what others are saying!
This article by Simply Wall St is general in nature. We provide commentary based on historical data and analyst forecasts only using an unbiased methodology and our articles are not intended to be financial advice. It does not constitute a recommendation to buy or sell any stock, and does not take account of your objectives, or your financial situation. We aim to bring you long-term focused analysis driven by fundamental data. Note that our analysis may not factor in the latest price-sensitive company announcements or qualitative material. Simply Wall St has no position in any stocks mentioned.
Have feedback on this article? Concerned about the content? Get in touch with us directly. Alternatively, email editorial-team@simplywallst.com