
 Nasdaq
 華爾街日報
華爾街日報Is Eaton’s Electrification Boom Already Priced In After Its Powerful Multi Year Run?
- Wondering if Eaton at around $323 a share is still a smart buy or if most of the upside is already priced in? Let us unpack what the market might be missing in the current valuation.
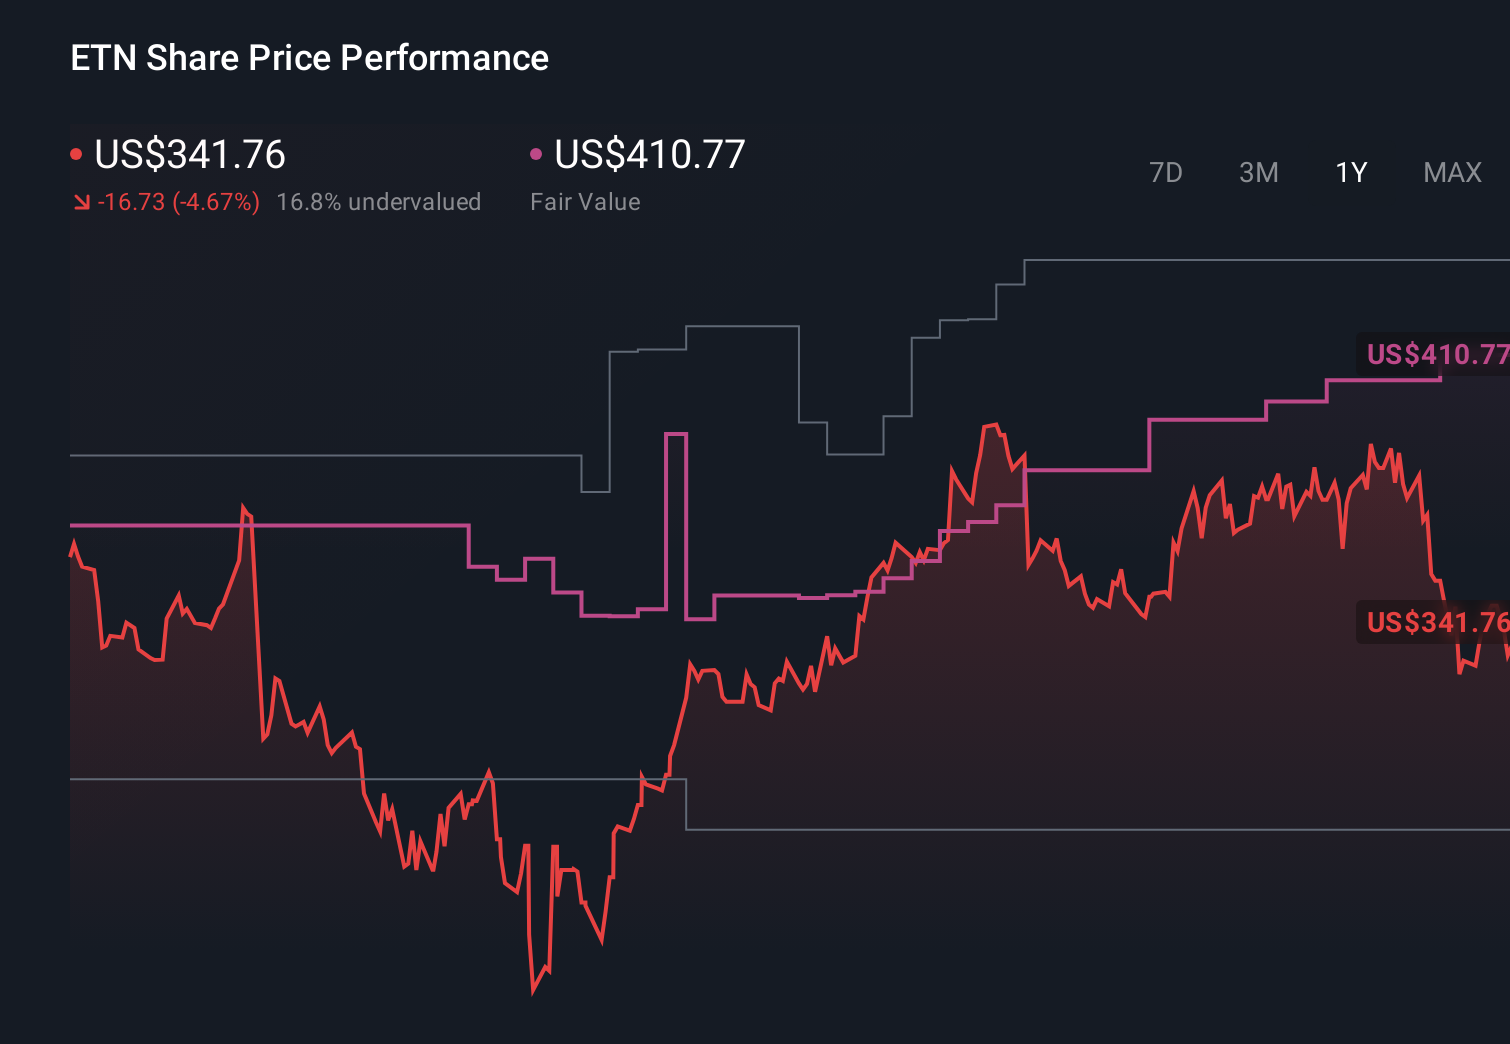
- Even after a modest 2.5% gain over the last week, the stock is still down 2.0% over the past month and 2.5% year to date. This looks like a pause after a powerful multi year run of 116.9% over three years and 195.2% over five.
- Recent headlines have focused on Eaton as a key beneficiary of long term spending on electrification and grid modernization, from data centers to renewables infrastructure. At the same time, broader market rotation away from industrial names and worries about the cycle have introduced more short term volatility into the share price.
- Right now, Eaton scores a 3/6 valuation check score, suggesting it trades near fair value on some metrics but could offer upside on others. Next we will walk through those approaches and then finish with a more complete way to think about the stock's true worth.
Find out why Eaton's -4.0% return over the last year is lagging behind its peers.
Approach 1: Eaton Discounted Cash Flow (DCF) Analysis
A Discounted Cash Flow model estimates what a business is worth by projecting the cash it can generate in the future and discounting those $ figures back to today. For Eaton, the model uses a 2 Stage Free Cash Flow to Equity approach, starting from last twelve months free cash flow of about $3.27 billion.
Analysts provide several years of forecasts, and beyond that, Simply Wall St extrapolates the trend. Under this framework, Eaton’s free cash flow is projected to rise to roughly $4.38 billion by 2026 and hover in the $4.8 billion to $5.5 billion range later in the next decade, with each year discounted back to reflect risk and the time value of money.
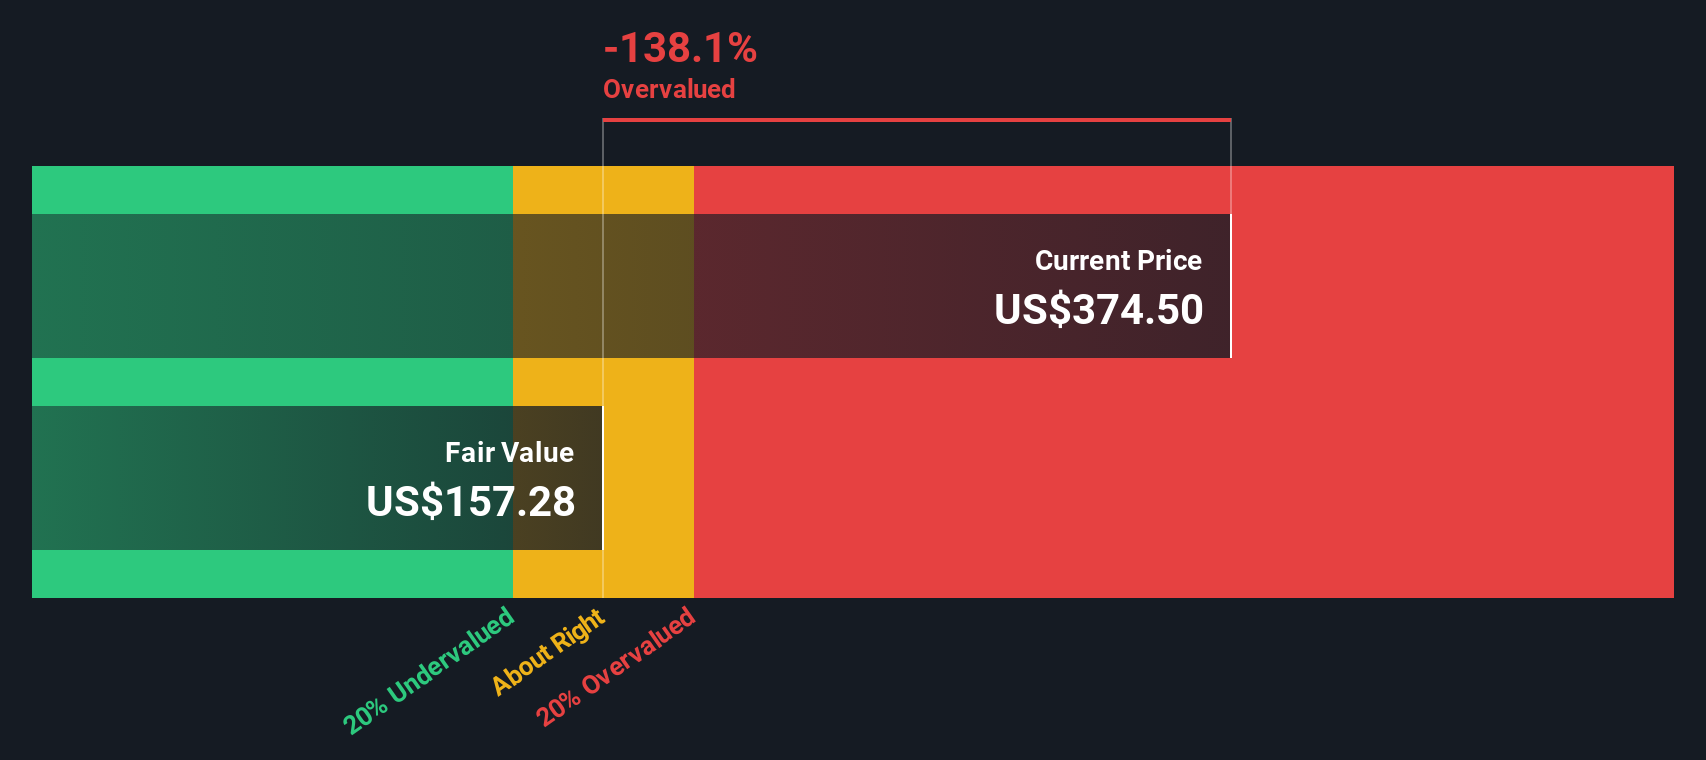
Adding all those discounted cash flows together yields an estimated intrinsic value of about $155.37 per share. Versus a market price around $323, the DCF points to the stock trading roughly 108.3% above its calculated fair value, based on these assumptions.
Result: OVERVALUED
Our Discounted Cash Flow (DCF) analysis suggests Eaton may be overvalued by 108.3%. Discover 903 undervalued stocks or create your own screener to find better value opportunities.
Approach 2: Eaton Price vs Earnings
For a mature, profitable business like Eaton, the price to earnings ratio is a practical way to gauge how much investors are willing to pay for each dollar of current earnings. It captures not only today’s profitability, but also what the market expects for future growth and how risky those earnings are perceived to be.
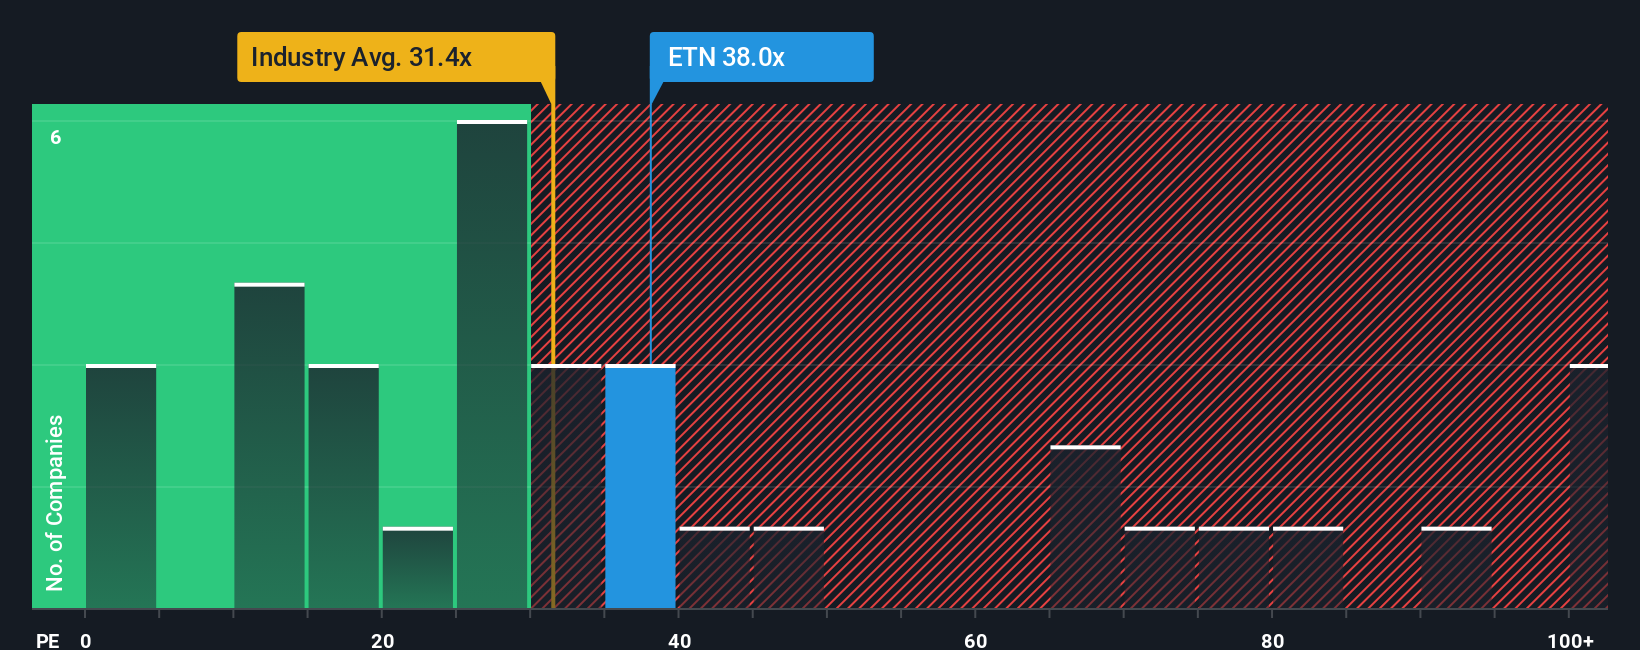
In general, faster growing and lower risk companies tend to trade on a higher PE multiple. Slower, more cyclical or riskier businesses typically trade on a lower multiple. Eaton currently trades on about 32.0x earnings, which is a premium to the Electrical industry average of roughly 30.3x, but a discount to its peer group, which averages around 44.9x.
Simply Wall St’s proprietary Fair Ratio framework estimates what a reasonable PE should be for Eaton after factoring in its earnings growth outlook, profit margins, industry characteristics, market cap and key risks. On this basis, Eaton’s Fair Ratio comes out at about 37.8x, which is higher than the current 32.0x market multiple. That indicates the stock trades below the level implied by its fundamentals, suggesting some valuation headroom if execution and growth stay on track.
Result: UNDERVALUED
PE ratios tell one story, but what if the real opportunity lies elsewhere? Discover 1460 companies where insiders are betting big on explosive growth.
Upgrade Your Decision Making: Choose your Eaton Narrative
Earlier we mentioned that there is an even better way to understand valuation, so let us introduce you to Narratives, a simple way to connect your view of a company with the numbers behind its future. A Narrative is the story you believe about Eaton, translated into assumptions about revenue growth, earnings, margins and risk, which then flow into a financial forecast and a fair value estimate. On Simply Wall St, millions of investors build and share these Narratives on the Community page, so it is easy and accessible to see how different perspectives stack up. Once you have a Narrative, you can compare its Fair Value to the current share price to decide whether Eaton looks like a buy, a hold or a sell, and that view automatically updates as new earnings, news and guidance come in. For example, one optimistic Eaton Narrative might see strong data center demand justifying a fair value near $440, while a more cautious view, focused on cyclicality and execution risks, could anchor closer to $288, and Narratives help you decide which story you find more convincing.
Do you think there's more to the story for Eaton? Head over to our Community to see what others are saying!
This article by Simply Wall St is general in nature. We provide commentary based on historical data and analyst forecasts only using an unbiased methodology and our articles are not intended to be financial advice. It does not constitute a recommendation to buy or sell any stock, and does not take account of your objectives, or your financial situation. We aim to bring you long-term focused analysis driven by fundamental data. Note that our analysis may not factor in the latest price-sensitive company announcements or qualitative material. Simply Wall St has no position in any stocks mentioned.
Have feedback on this article? Concerned about the content? Get in touch with us directly. Alternatively, email editorial-team@simplywallst.com