
 Nasdaq
 華爾街日報
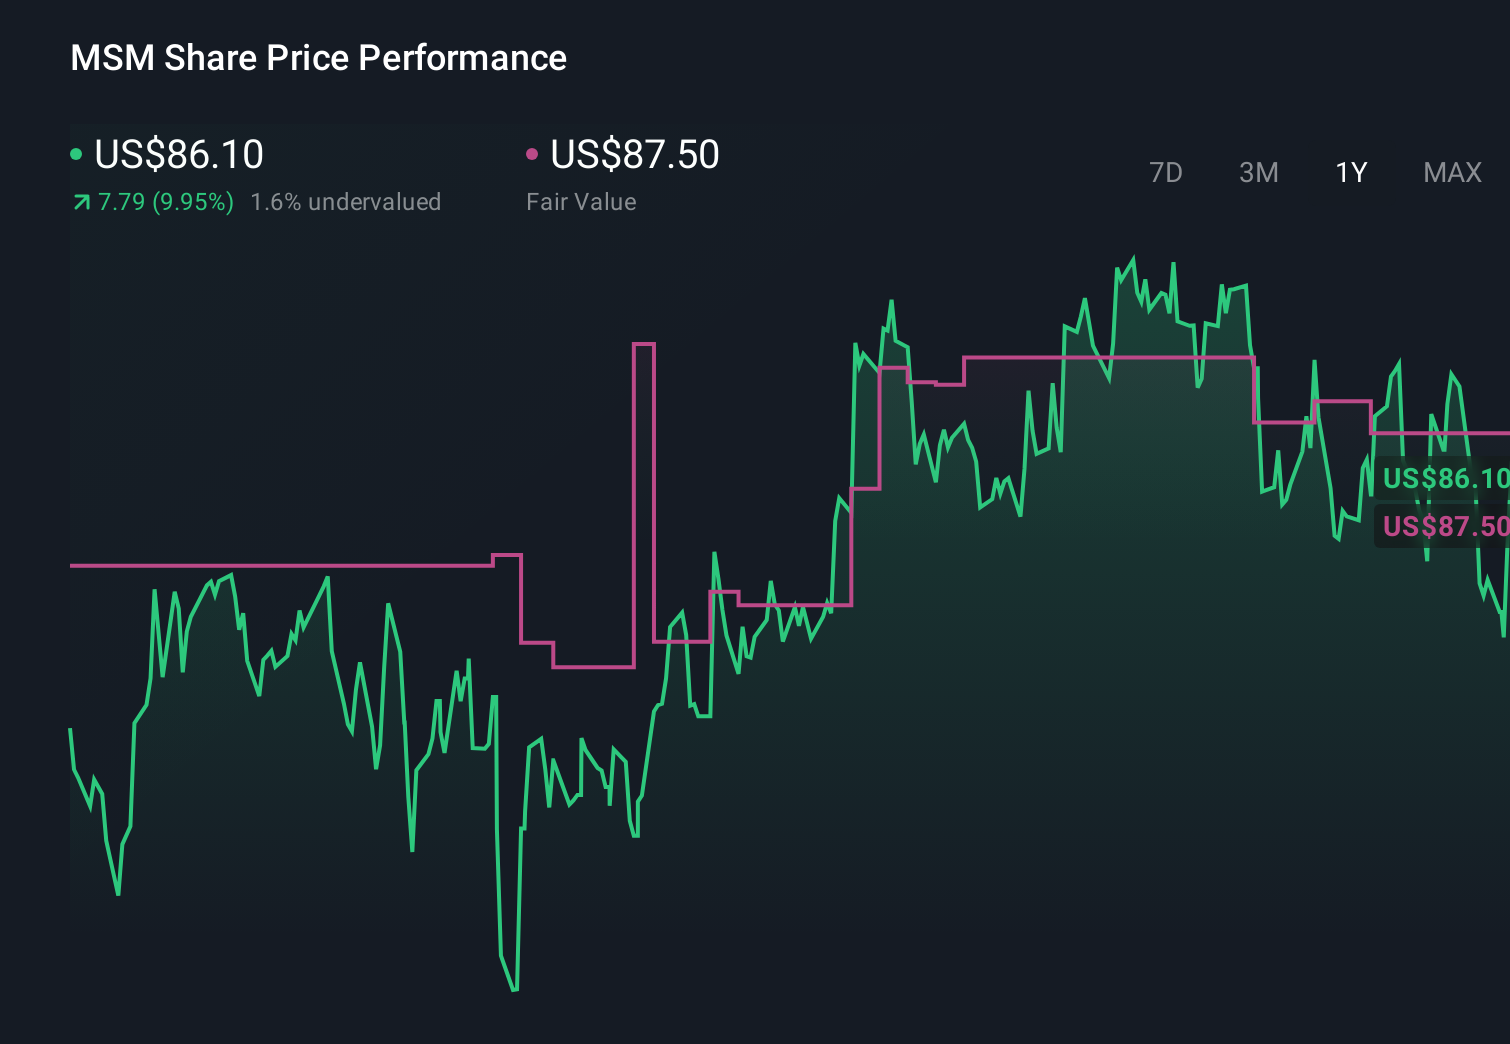
華爾街日報Is MSC Industrial Direct Still Attractive After Its Steady 2025 Share Price Climb?
- Wondering if MSC Industrial Direct is still good value after its recent run, or if the easy money has already been made? Let us break down what the current price might really be telling you about future returns.
- The stock has inched up about 1.1% over the last week and is flat over 30 days, but it is still up around 15.7% year to date and 18.3% over the past year, suggesting steady optimism rather than a speculative spike.
- That gradual climb has come as investors focus on MSC Industrial Direct's role as a key distributor to manufacturing and industrial customers, with themes like reshoring, supply chain resilience, and ongoing automation demand supporting the long term story. At the same time, the market is weighing cyclicality in industrial spending and how management allocates capital between growth initiatives and shareholder returns.
- Despite those supportive trends, MSC Industrial Direct currently scores just 0 out of 6 on our valuation checks. This suggests the market might already be pricing in a lot of the good news. In the next sections we will walk through different valuation lenses to see why that is, and finish with a more nuanced way to think about what the stock is really worth.
MSC Industrial Direct scores just 0/6 on our valuation checks. See what other red flags we found in the full valuation breakdown.
Approach 1: MSC Industrial Direct Discounted Cash Flow (DCF) Analysis
A Discounted Cash Flow model estimates what a business is worth by projecting the cash it can generate in the future, then discounting those cash flows back into today’s dollars. For MSC Industrial Direct, the latest twelve month Free Cash Flow stands at about $241.3 Million, providing the starting point for the analysis.
Analysts and model estimates expect Free Cash Flow to rise to roughly $214.9 Million in 2026 and to peak around $306 Million in 2029. It is then projected to ease back to about $248 Million by 2030, with later years extrapolated by Simply Wall St. These projected cash flows are discounted using a 2 Stage Free Cash Flow to Equity framework to arrive at an estimated intrinsic value of $60.35 per share.
Compared with the current share price, this DCF outcome implies MSC Industrial Direct is about 44.2% overvalued. This suggests the market is paying a premium for its cash generation and growth prospects.
Result: OVERVALUED
Our Discounted Cash Flow (DCF) analysis suggests MSC Industrial Direct may be overvalued by 44.2%. Discover 903 undervalued stocks or create your own screener to find better value opportunities.

Approach 2: MSC Industrial Direct Price vs Earnings
For profitable companies like MSC Industrial Direct, the price to earnings, or PE, ratio is a useful way to gauge how much investors are willing to pay for each dollar of current profit. In general, faster growth and lower perceived risk justify a higher, or more expensive, PE ratio, while slower growth or higher uncertainty usually call for a lower multiple.
MSC Industrial Direct currently trades on a PE of about 24.36x. That is richer than both the Trade Distributors industry average of roughly 20.72x and the broader peer group average of about 20.99x, suggesting investors are paying a premium relative to similar businesses. To go a step further, Simply Wall St calculates a proprietary Fair Ratio of around 20.75x, which estimates what a reasonable PE should be given MSC Industrial Direct’s specific mix of earnings growth, profitability, size, industry positioning and risk profile.
Because this Fair Ratio is tailored to the company rather than just its sector, it provides a more nuanced benchmark than simple peer or industry comparisons. With the current 24.36x multiple sitting notably above the 20.75x Fair Ratio, the stock screens as overvalued on this measure.
Result: OVERVALUED

PE ratios tell one story, but what if the real opportunity lies elsewhere? Discover 1460 companies where insiders are betting big on explosive growth.
Upgrade Your Decision Making: Choose your MSC Industrial Direct Narrative
Earlier we mentioned that there is an even better way to understand valuation, so let us introduce you to Narratives. Simply Wall St makes these available to millions of investors on each company’s Community page. A Narrative is your story about a business, where you connect what you believe about MSC Industrial Direct’s strategy, demand outlook, margins and risks to a concrete financial forecast and, ultimately, to a Fair Value estimate you can compare against today’s share price to decide whether to buy, hold, or sell. The platform dynamically updates that Fair Value as new information like earnings, CEO changes or macro news comes in, and allows different investors to express very different views. For example, one investor might build a bullish Narrative that assumes revenue grows faster, margins expand toward the upper end of expectations and supports a fair value closer to the high analyst target of about $105. Another more cautious investor might emphasize soft demand, tariff and execution risks, use lower growth and margin assumptions, and arrive at a fair value closer to the low analyst target near $81.
Do you think there's more to the story for MSC Industrial Direct? Head over to our Community to see what others are saying!
This article by Simply Wall St is general in nature. We provide commentary based on historical data and analyst forecasts only using an unbiased methodology and our articles are not intended to be financial advice. It does not constitute a recommendation to buy or sell any stock, and does not take account of your objectives, or your financial situation. We aim to bring you long-term focused analysis driven by fundamental data. Note that our analysis may not factor in the latest price-sensitive company announcements or qualitative material. Simply Wall St has no position in any stocks mentioned.
Have feedback on this article? Concerned about the content? Get in touch with us directly. Alternatively, email editorial-team@simplywallst.com