
 Nasdaq
 華爾街日報
華爾街日報3 Stocks Estimated To Be Trading At Discounts Of 23.1% To 41.2%
In a robust market environment where the Dow Jones and S&P 500 have recently set new records, investors are keenly observing opportunities that may be overlooked amid widespread gains. Identifying undervalued stocks can be particularly rewarding in such conditions, as they offer potential value not yet recognized by the broader market.
Top 10 Undervalued Stocks Based On Cash Flows In The United States
| Name | Current Price | Fair Value (Est) | Discount (Est) |
| Zymeworks (ZYME) | $26.86 | $52.58 | 48.9% |
| UMB Financial (UMBF) | $118.90 | $233.12 | 49% |
| Sportradar Group (SRAD) | $23.11 | $45.55 | 49.3% |
| SmartStop Self Storage REIT (SMA) | $31.57 | $61.46 | 48.6% |
| Perfect (PERF) | $1.75 | $3.42 | 48.9% |
| Nicolet Bankshares (NIC) | $124.56 | $242.21 | 48.6% |
| Community West Bancshares (CWBC) | $22.74 | $44.11 | 48.4% |
| Columbia Banking System (COLB) | $28.62 | $56.93 | 49.7% |
| Clearfield (CLFD) | $29.43 | $58.37 | 49.6% |
| BioLife Solutions (BLFS) | $25.41 | $49.94 | 49.1% |
Here we highlight a subset of our preferred stocks from the screener.
Workday (WDAY)
Overview: Workday, Inc. is a provider of enterprise cloud applications serving both the United States and international markets, with a market cap of $57.03 billion.
Operations: Workday generates its revenue primarily from cloud applications, amounting to $9.23 billion.
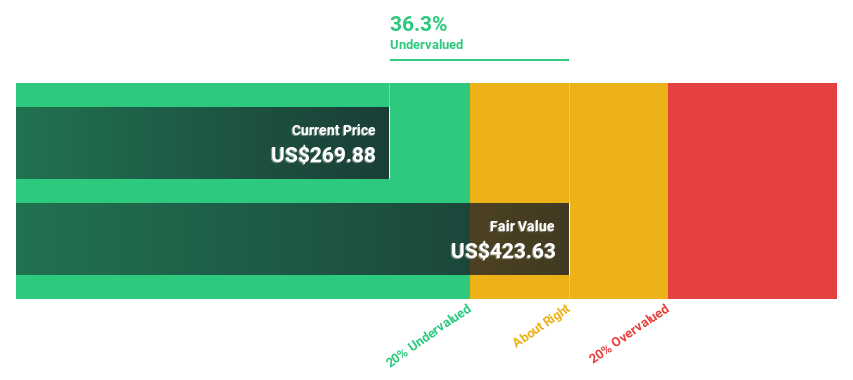
Estimated Discount To Fair Value: 37.5%
Workday is trading at US$216.85, significantly below its estimated fair value of US$347.1, suggesting undervaluation based on cash flows. Despite a decline in profit margins from 19.9% to 7%, earnings are forecasted to grow annually by 32.2%, outpacing the broader U.S. market's growth rate of 16.2%. Recent strategic moves include share buybacks totaling $1 billion and partnerships enhancing AI capabilities, which may bolster future cash flow performance and operational efficiencies.
- Our growth report here indicates Workday may be poised for an improving outlook.
- Take a closer look at Workday's balance sheet health here in our report.
Dycom Industries (DY)
Overview: Dycom Industries, Inc. offers specialty contracting services to the telecommunications infrastructure and utility sectors in the United States, with a market cap of approximately $10.09 billion.
Operations: The company's revenue primarily comes from its general contracting services, amounting to approximately $5.17 billion.
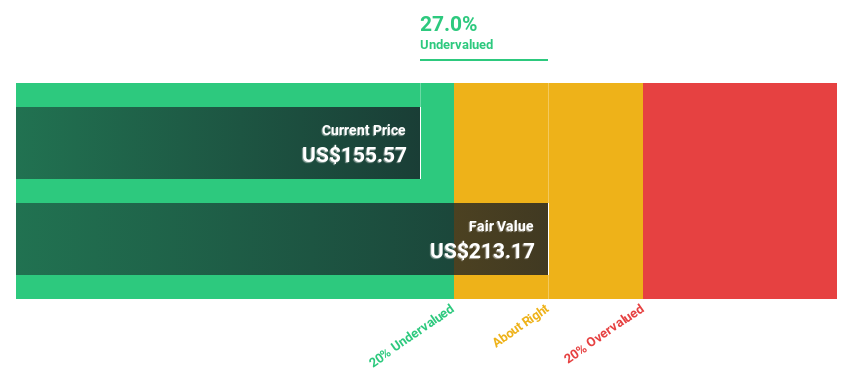
Estimated Discount To Fair Value: 23.1%
Dycom Industries is trading at US$348.4, below its estimated fair value of US$452.77, indicating undervaluation based on cash flows. Despite high debt levels, earnings grew 32.7% over the past year and are forecast to grow annually by 18.1%, faster than the U.S. market's 16.2%. Recent credit agreement amendments enhance financial flexibility with increased loan facilities and extended maturities, potentially supporting future cash flow generation and operational growth initiatives.
- The growth report we've compiled suggests that Dycom Industries' future prospects could be on the up.
- Navigate through the intricacies of Dycom Industries with our comprehensive financial health report here.
Fidelity National Information Services (FIS)
Overview: Fidelity National Information Services, Inc. (FIS) operates as a global provider of financial technology solutions, with a market cap of approximately $34.78 billion.
Operations: The company's revenue segments include Banking Solutions, generating $7.14 billion, and Capital Market Solutions, contributing $3.13 billion.
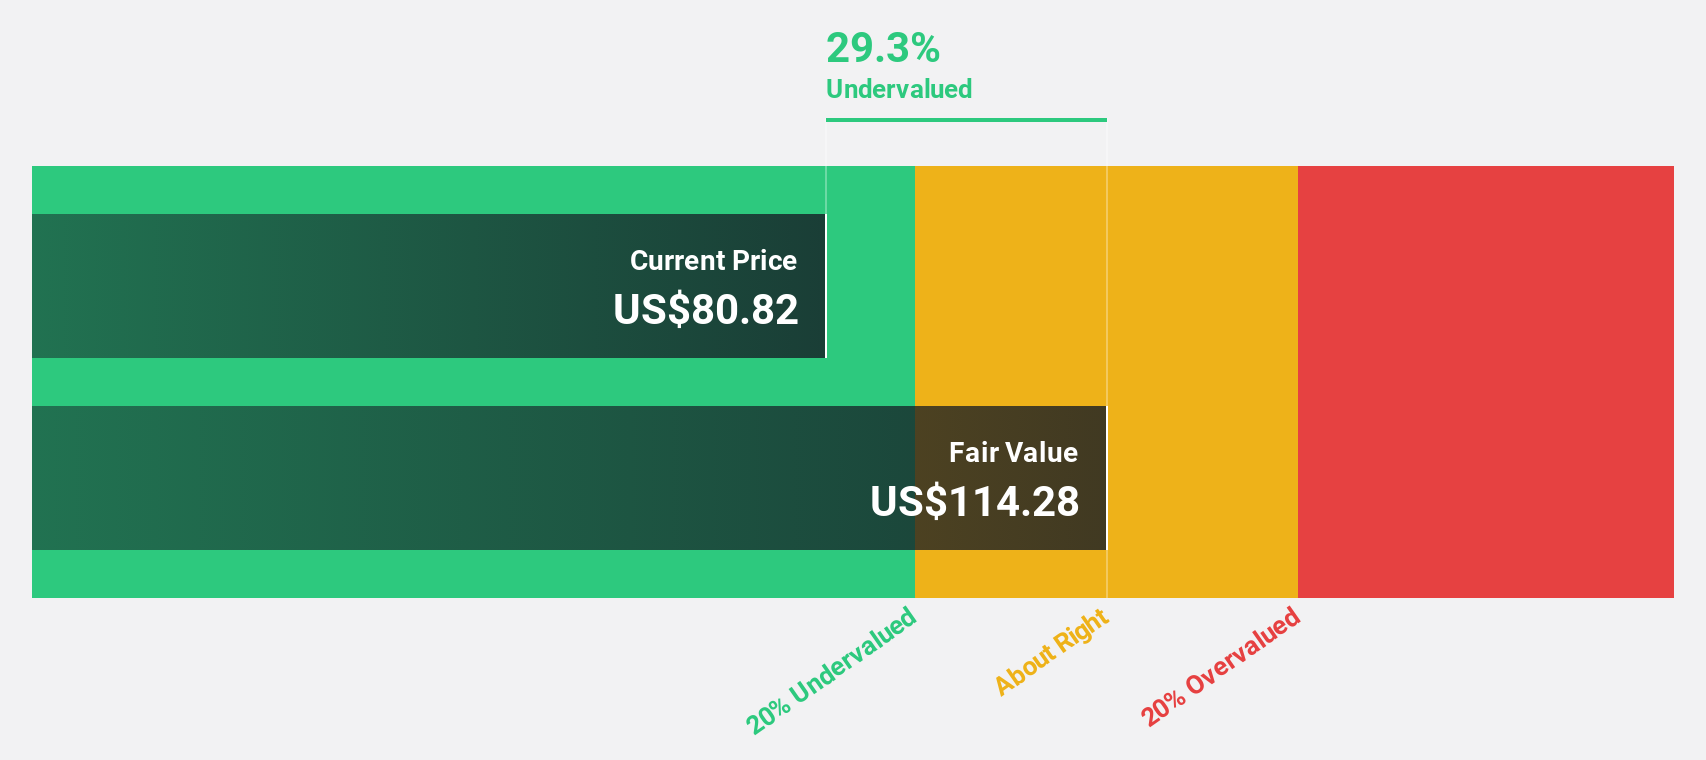
Estimated Discount To Fair Value: 41.2%
Fidelity National Information Services (FIS) is trading at US$67.17, significantly below its estimated fair value of US$114.18, highlighting undervaluation based on cash flows. Despite high debt levels and reduced profit margins from 5.4% to 1.7%, FIS's earnings are forecasted to grow significantly at 47.6% annually, surpassing the U.S. market average growth rate of 16.2%. Recent product enhancements and strategic partnerships aim to bolster operational efficiency and financial flexibility, potentially enhancing future cash flow generation.
- The analysis detailed in our Fidelity National Information Services growth report hints at robust future financial performance.
- Click here and access our complete balance sheet health report to understand the dynamics of Fidelity National Information Services.
Turning Ideas Into Actions
- Click here to access our complete index of 208 Undervalued US Stocks Based On Cash Flows.
- Invested in any of these stocks? Simplify your portfolio management with Simply Wall St and stay ahead with our alerts for any critical updates on your stocks.
- Unlock the power of informed investing with Simply Wall St, your free guide to navigating stock markets worldwide.
Looking For Alternative Opportunities?
- Explore high-performing small cap companies that haven't yet garnered significant analyst attention.
- Diversify your portfolio with solid dividend payers offering reliable income streams to weather potential market turbulence.
- Fuel your portfolio with companies showing strong growth potential, backed by optimistic outlooks both from analysts and management.
This article by Simply Wall St is general in nature. We provide commentary based on historical data and analyst forecasts only using an unbiased methodology and our articles are not intended to be financial advice. It does not constitute a recommendation to buy or sell any stock, and does not take account of your objectives, or your financial situation. We aim to bring you long-term focused analysis driven by fundamental data. Note that our analysis may not factor in the latest price-sensitive company announcements or qualitative material. Simply Wall St has no position in any stocks mentioned.
Have feedback on this article? Concerned about the content? Get in touch with us directly. Alternatively, email editorial-team@simplywallst.com