
 Nasdaq
 華爾街日報
華爾街日報3 European Stocks Estimated To Be Up To 33.5% Below Intrinsic Value
As European markets experience a boost from steady economic growth and looser monetary policies, the pan-European STOXX Europe 600 Index has risen by 1.60%, with major stock indexes also showing gains. In this context of cautious optimism, identifying undervalued stocks can present opportunities for investors seeking to capitalize on potential price corrections as market conditions stabilize.
Top 10 Undervalued Stocks Based On Cash Flows In Europe
| Name | Current Price | Fair Value (Est) | Discount (Est) |
| Streamwide (ENXTPA:ALSTW) | €72.60 | €142.21 | 49% |
| Sanoma Oyj (HLSE:SANOMA) | €9.21 | €18.38 | 49.9% |
| Redelfi (BIT:RDF) | €11.70 | €23.31 | 49.8% |
| Outokumpu Oyj (HLSE:OUT1V) | €4.278 | €8.48 | 49.6% |
| LINK Mobility Group Holding (OB:LINK) | NOK32.95 | NOK65.81 | 49.9% |
| Hemnet Group (OM:HEM) | SEK170.90 | SEK337.00 | 49.3% |
| cyan (XTRA:CYR) | €2.26 | €4.50 | 49.8% |
| Artifex Mundi (WSE:ART) | PLN12.20 | PLN24.34 | 49.9% |
| Allegro.eu (WSE:ALE) | PLN30.625 | PLN60.10 | 49% |
| Allcore (BIT:CORE) | €1.345 | €2.66 | 49.4% |
Here's a peek at a few of the choices from the screener.
Kinepolis Group (ENXTBR:KIN)
Overview: Kinepolis Group NV operates and manages cinemas across Belgium, France, Canada, Spain, the Netherlands, the United States, Luxembourg, and internationally with a market cap of €794.43 million.
Operations: The company's revenue is primarily derived from the Box Office (€308.55 million), In-Theatre Sales (€191.65 million), Business-To-Business activities (€64.72 million), Real Estate (€14.73 million), and Film Distribution (€3.26 million).
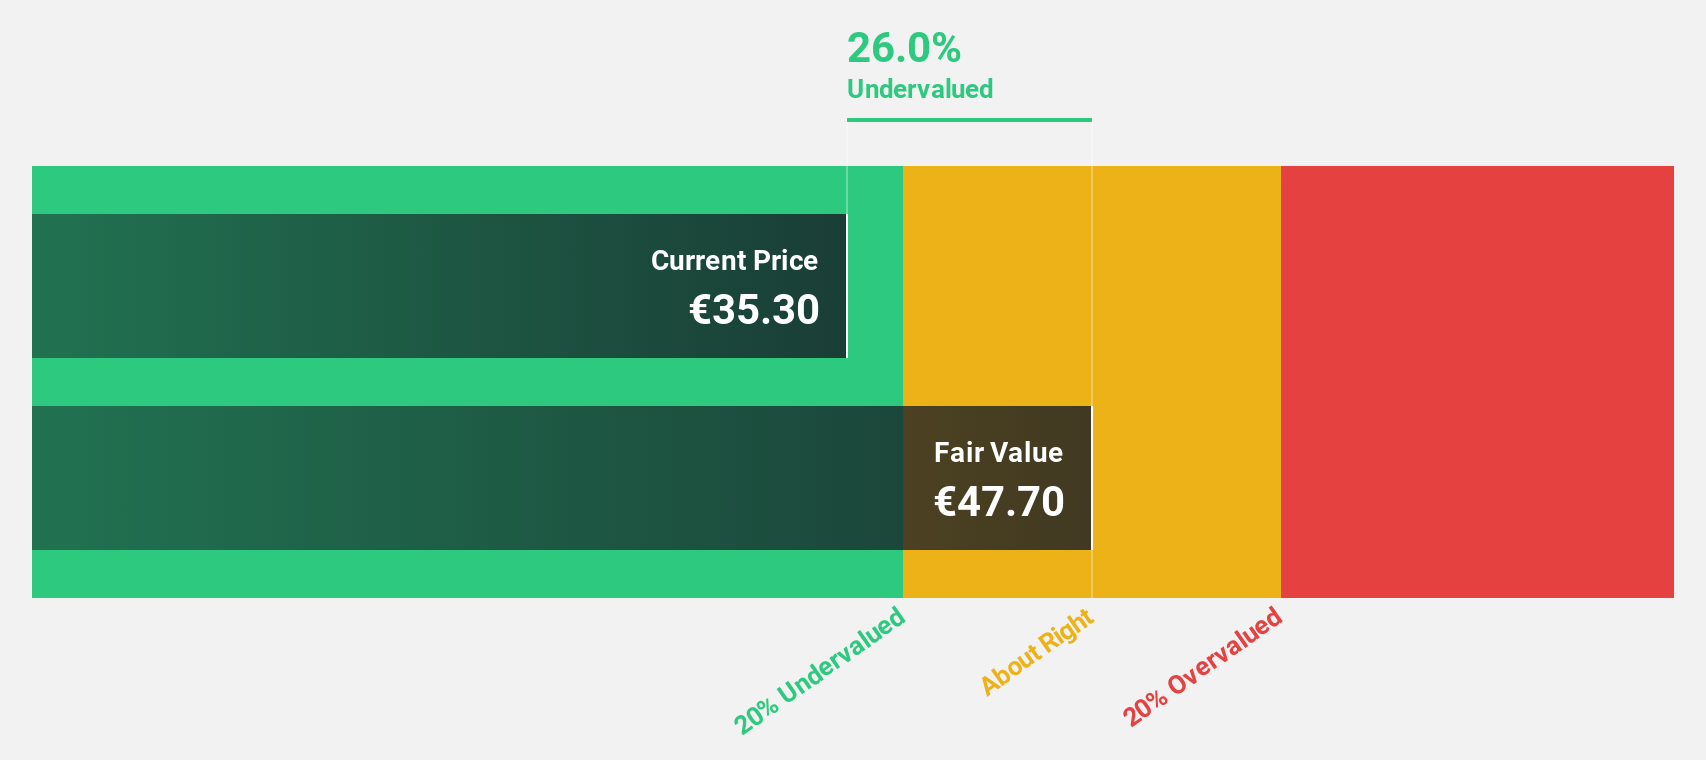
Estimated Discount To Fair Value: 33.5%
Kinepolis Group is trading at €29.7, significantly below its estimated fair value of €44.65, presenting a potential undervaluation based on cash flows. Despite high debt levels, the company's earnings are projected to grow by 22.27% annually over the next three years, outpacing both its revenue growth and the broader Belgian market's earnings growth rate of 15.3%. Analysts agree on a potential stock price increase of 58.2%, highlighting optimistic prospects for investors focused on cash flow valuation metrics in Europe.
- The growth report we've compiled suggests that Kinepolis Group's future prospects could be on the up.
- Delve into the full analysis health report here for a deeper understanding of Kinepolis Group.
Troax Group (OM:TROAX)
Overview: Troax Group AB (publ) is a company that produces and sells mesh panels across the Nordic region, the United Kingdom, North America, Europe, and internationally with a market cap of SEK8.86 billion.
Operations: Troax Group generates revenue of €267.94 million from its mesh panels segment across various regions, including the Nordics, the UK, North America, and Europe.
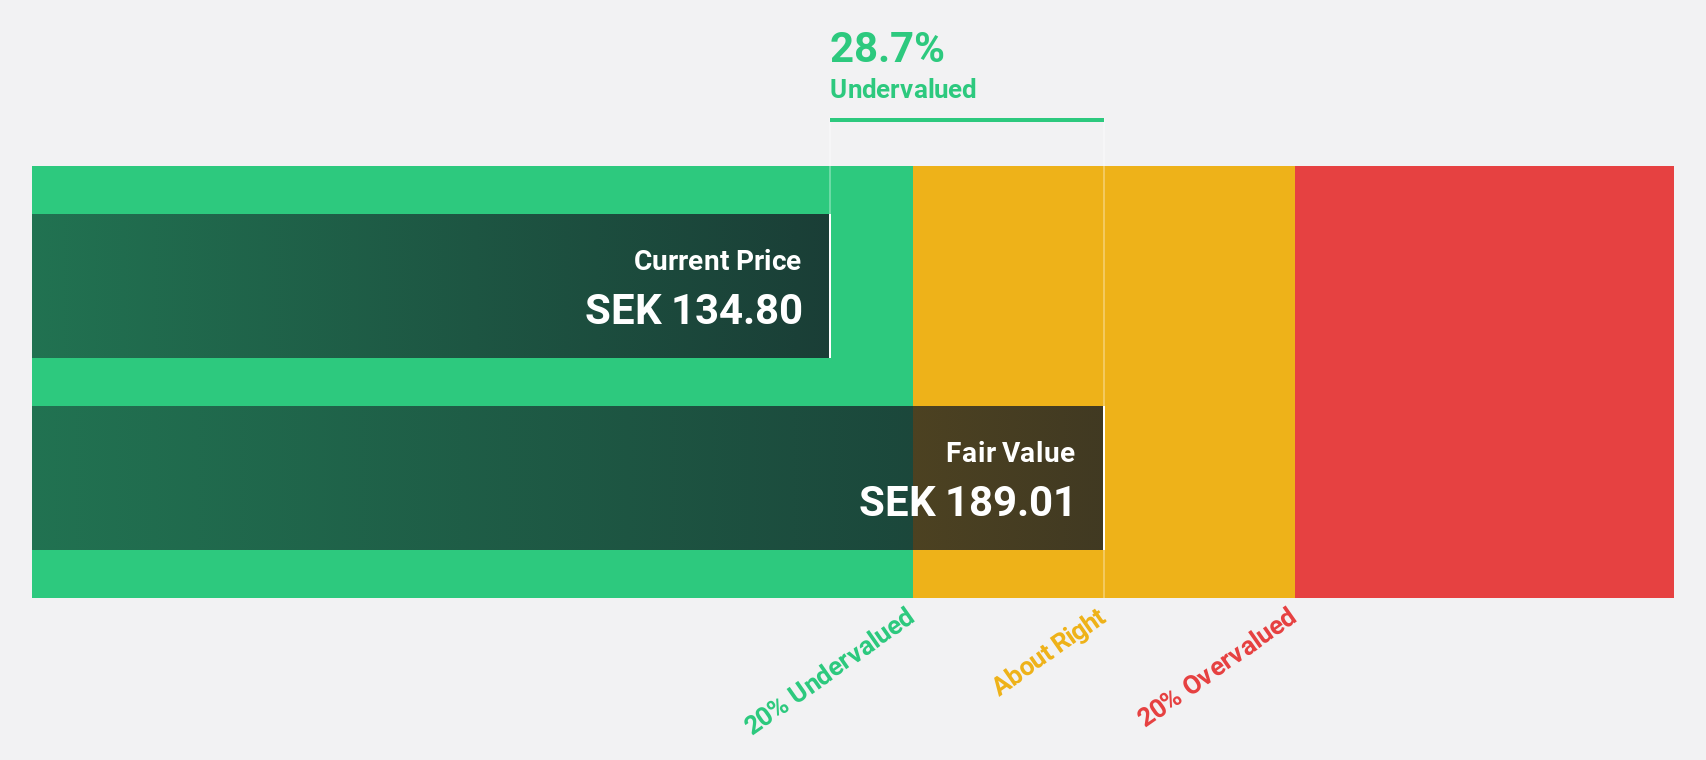
Estimated Discount To Fair Value: 19%
Troax Group, trading at SEK148, is undervalued relative to its fair value estimate of SEK182.61. Despite recent declines in sales and net income for Q3 2025, Troax's earnings are forecast to grow significantly by 35.22% annually, surpassing the Swedish market's growth rate of 13.6%. Analysts anticipate a potential stock price increase of 29.1%. However, its dividend yield of 2.48% lacks sufficient earnings coverage and a CFO transition is forthcoming in 2026.
- Our growth report here indicates Troax Group may be poised for an improving outlook.
- Click to explore a detailed breakdown of our findings in Troax Group's balance sheet health report.
Delivery Hero (XTRA:DHER)
Overview: Delivery Hero SE operates in online food ordering, quick commerce, and delivery services with a market cap of €6.55 billion.
Operations: Revenue segments for Delivery Hero SE include €4.28 billion from Asia, €2.16 billion from Europe, €1.02 billion from the Americas, €2.95 billion from Integrated Verticals, and €3.89 billion from MENA (Middle East and North Africa).
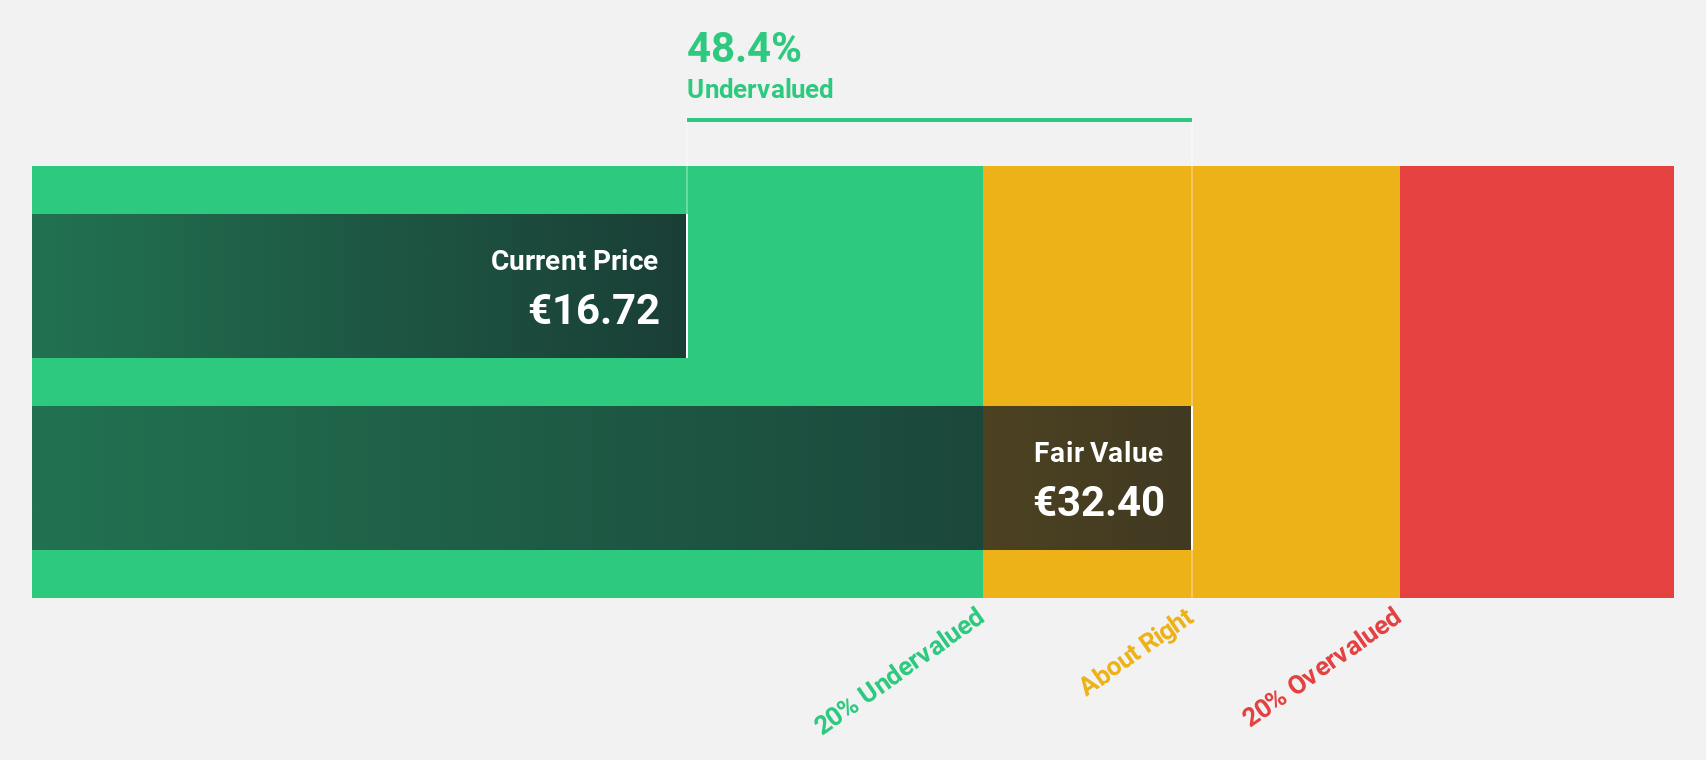
Estimated Discount To Fair Value: 33.1%
Delivery Hero is currently trading at €21.97, significantly below its estimated fair value of €32.86, indicating it may be undervalued based on cash flows. Despite a volatile share price and shareholder pressure to consider strategic changes, the company's revenue is expected to grow 10.1% annually, outpacing the German market's growth rate. While profitability is anticipated within three years, Return on Equity remains low at 14.1%, presenting both opportunities and challenges for investors evaluating its potential value.
- According our earnings growth report, there's an indication that Delivery Hero might be ready to expand.
- Click here and access our complete balance sheet health report to understand the dynamics of Delivery Hero.
Where To Now?
- Explore the 192 names from our Undervalued European Stocks Based On Cash Flows screener here.
- Are these companies part of your investment strategy? Use Simply Wall St to consolidate your holdings into a portfolio and gain insights with our comprehensive analysis tools.
- Enhance your investing ability with the Simply Wall St app and enjoy free access to essential market intelligence spanning every continent.
Ready To Venture Into Other Investment Styles?
- Explore high-performing small cap companies that haven't yet garnered significant analyst attention.
- Diversify your portfolio with solid dividend payers offering reliable income streams to weather potential market turbulence.
- Fuel your portfolio with companies showing strong growth potential, backed by optimistic outlooks both from analysts and management.
This article by Simply Wall St is general in nature. We provide commentary based on historical data and analyst forecasts only using an unbiased methodology and our articles are not intended to be financial advice. It does not constitute a recommendation to buy or sell any stock, and does not take account of your objectives, or your financial situation. We aim to bring you long-term focused analysis driven by fundamental data. Note that our analysis may not factor in the latest price-sensitive company announcements or qualitative material. Simply Wall St has no position in any stocks mentioned.
Have feedback on this article? Concerned about the content? Get in touch with us directly. Alternatively, email editorial-team@simplywallst.com