
 Nasdaq
 華爾街日報
華爾街日報Global Market Insights: 3 Penny Stocks With Market Caps Over US$700M
As global markets navigate a complex landscape marked by mixed performance in major indices and shifting economic indicators, investors are increasingly exploring diverse opportunities. Penny stocks, though often considered niche investments, continue to attract attention due to their potential for growth within smaller or newer companies. By focusing on those with robust financial health and clear growth potential, investors can uncover promising opportunities in this segment of the market.
Top 10 Penny Stocks Globally
| Name | Share Price | Market Cap | Rewards & Risks |
| Lever Style (SEHK:1346) | HK$1.48 | HK$915.41M | ✅ 4 ⚠️ 1 View Analysis > |
| Foresight Group Holdings (LSE:FSG) | £4.255 | £488.14M | ✅ 5 ⚠️ 0 View Analysis > |
| IVE Group (ASX:IGL) | A$3.00 | A$461.07M | ✅ 4 ⚠️ 2 View Analysis > |
| TK Group (Holdings) (SEHK:2283) | HK$2.55 | HK$2.12B | ✅ 4 ⚠️ 1 View Analysis > |
| Angler Gaming (NGM:ANGL) | SEK3.60 | SEK269.95M | ✅ 4 ⚠️ 2 View Analysis > |
| Angler Gaming (DB:0QM) | €0.37 | €221.21M | ✅ 3 ⚠️ 3 View Analysis > |
| Yangzijiang Shipbuilding (Holdings) (SGX:BS6) | SGD3.48 | SGD13.7B | ✅ 5 ⚠️ 1 View Analysis > |
| Integrated Diagnostics Holdings (LSE:IDHC) | $0.70 | $406.93M | ✅ 4 ⚠️ 2 View Analysis > |
| RGB International Bhd (KLSE:RGB) | MYR0.215 | MYR331.28M | ✅ 4 ⚠️ 3 View Analysis > |
| Begbies Traynor Group (AIM:BEG) | £1.145 | £184.26M | ✅ 6 ⚠️ 1 View Analysis > |
Click here to see the full list of 3,629 stocks from our Global Penny Stocks screener.
Here we highlight a subset of our preferred stocks from the screener.
Aurora OptoelectronicsLtd (SHSE:600666)
Simply Wall St Financial Health Rating: ★★★★☆☆
Overview: Aurora Optoelectronics Co., Ltd. specializes in the production and sale of sapphire crystal materials in China, with a market capitalization of CN¥89.62 billion.
Operations: Aurora Optoelectronics Co., Ltd. has not reported any specific revenue segments.
Market Cap: CN¥8.96B
Aurora Optoelectronics Co., Ltd. has recently shown promising financial performance, reporting sales of CN¥347.71 million and a net income of CN¥290.85 million for the nine months ended September 2025, reversing a previous net loss. The company has more cash than total debt and its short-term assets exceed both short and long-term liabilities, indicating solid liquidity management. Despite having a relatively inexperienced management team and board with average tenures of 1.4 years and 2.7 years respectively, Aurora's profitability marks significant progress in its financial trajectory within the penny stock landscape.
- Click here to discover the nuances of Aurora OptoelectronicsLtd with our detailed analytical financial health report.
- Gain insights into Aurora OptoelectronicsLtd's historical outcomes by reviewing our past performance report.

Kingland TechnologyLtd (SZSE:000711)
Simply Wall St Financial Health Rating: ★★★★☆☆
Overview: Kingland Technology Co., Ltd. offers ecological environment solutions in China and has a market cap of CN¥4.94 billion.
Operations: The company generates revenue of CN¥628.70 million from its operations in China.
Market Cap: CN¥4.94B
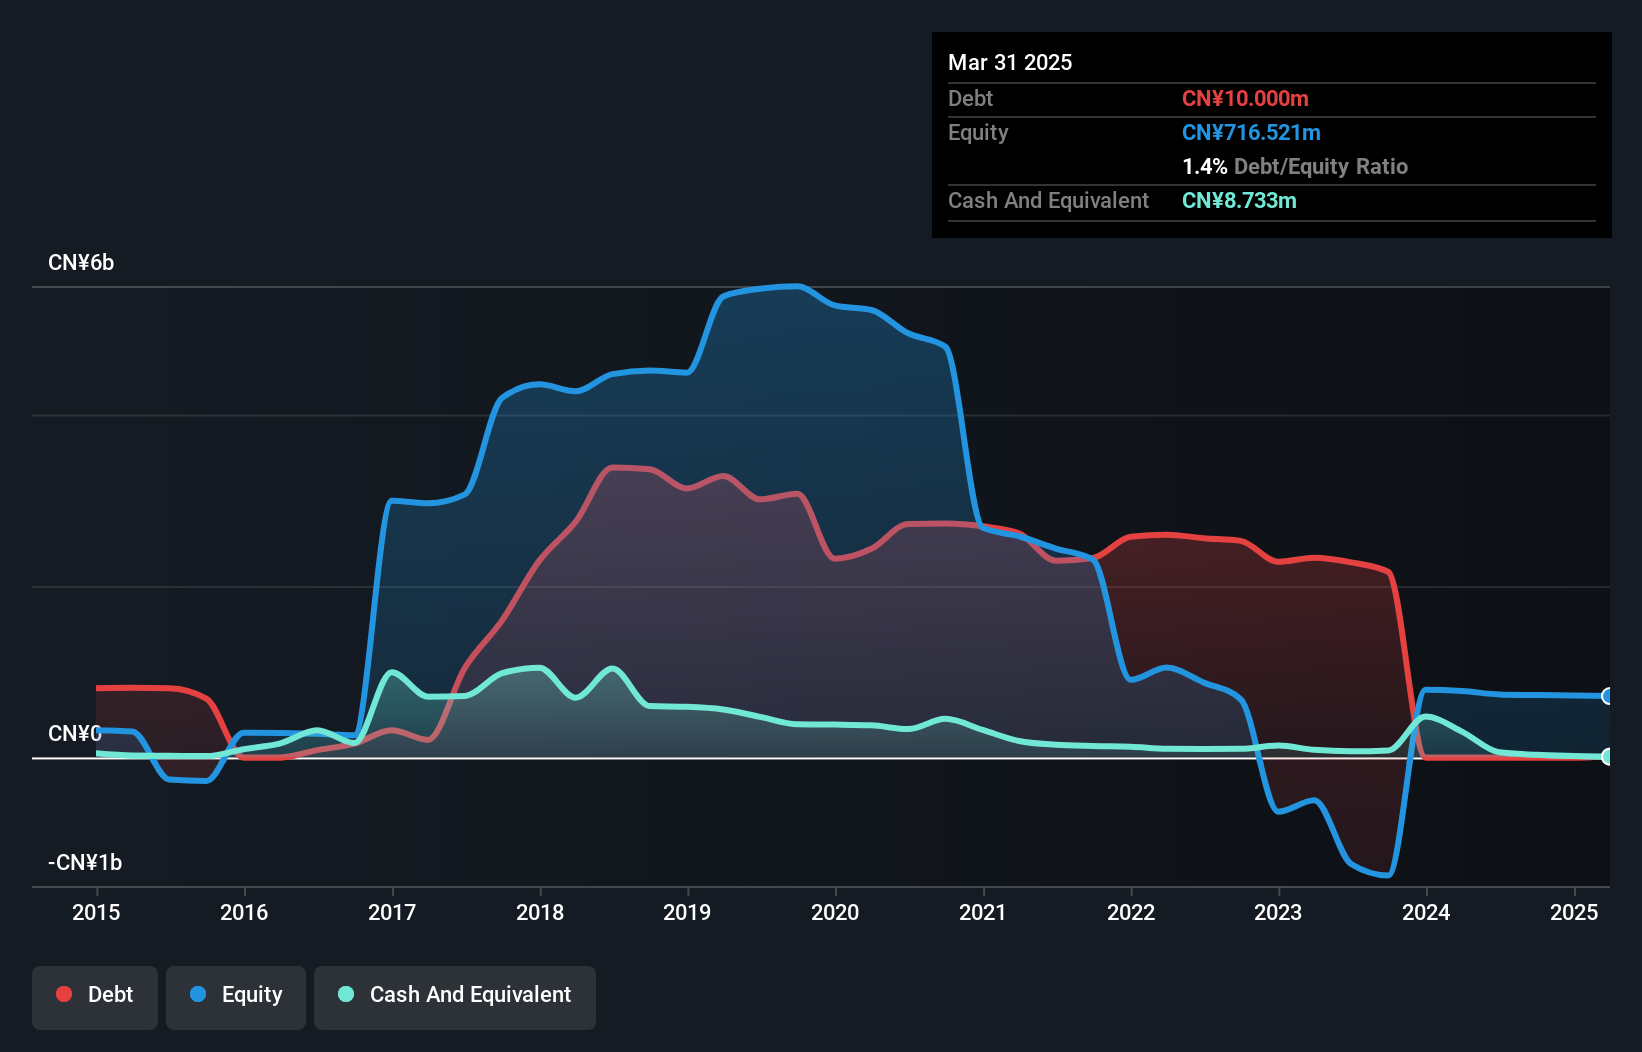
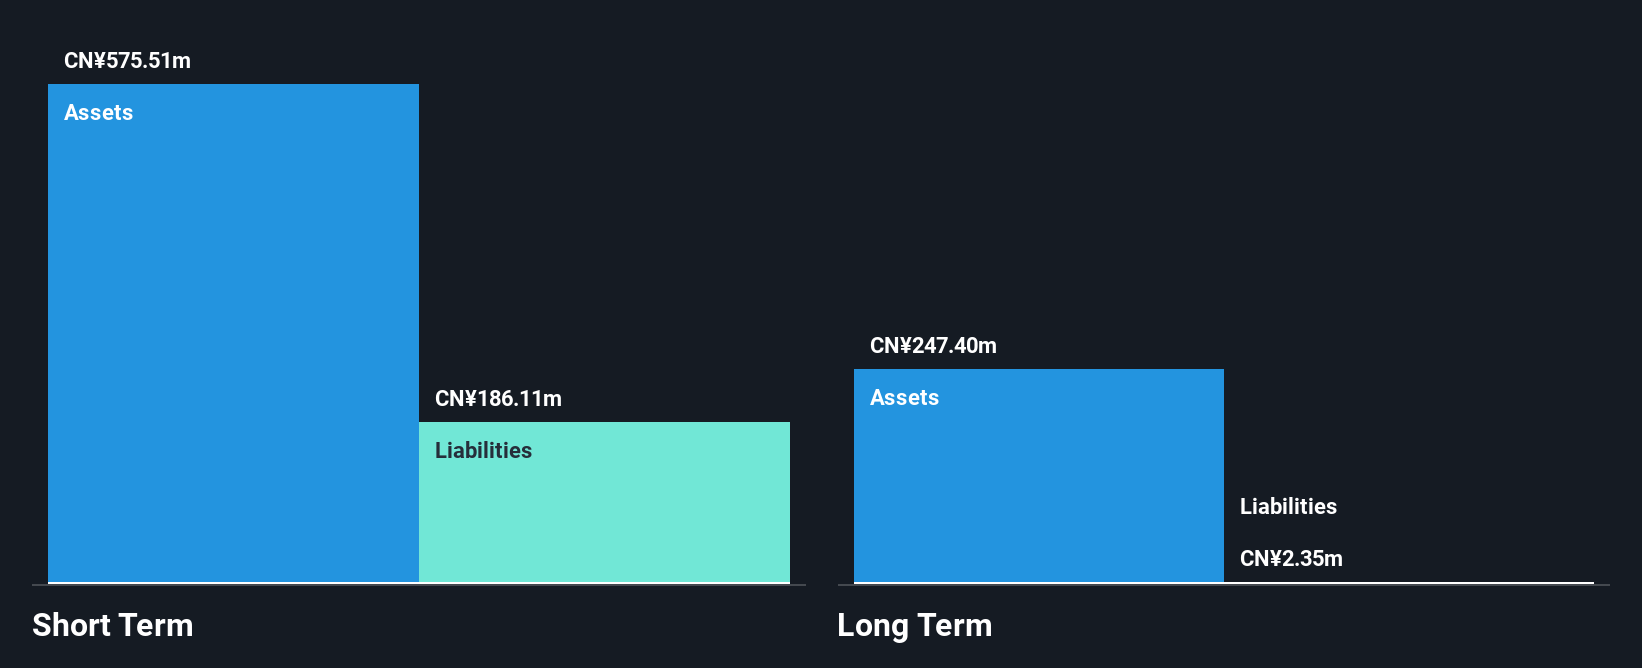
Kingland Technology Co., Ltd. has been navigating financial challenges, with a net loss of CN¥104.88 million reported for the nine months ending September 2025, despite revenue growth to CN¥331.54 million from CN¥80.7 million the previous year. The company's debt-to-equity ratio has improved significantly over five years, reducing to 8.3%, and its short-term assets exceed both short and long-term liabilities, suggesting adequate liquidity management. However, Kingland faces hurdles with less than a year's cash runway and an inexperienced management team averaging 1.9 years in tenure, alongside ongoing unprofitability impacting its return on equity negatively at -27.88%.
- Navigate through the intricacies of Kingland TechnologyLtd with our comprehensive balance sheet health report here.
- Learn about Kingland TechnologyLtd's historical performance here.
Shenzhen Hemei GroupLTD (SZSE:002356)
Simply Wall St Financial Health Rating: ★★★★★★
Overview: Shenzhen Hemei Group Co., LTD. operates in the sale of clothing and accessories both in China and internationally, with a market cap of CN¥5.04 billion.
Operations: Shenzhen Hemei Group Co., LTD. has not reported specific revenue segments, but it engages in the sale of clothing and accessories within China and internationally.
Market Cap: CN¥5.04B
Shenzhen Hemei Group Co., LTD. has shown a significant turnaround, reporting CN¥456.02 million in sales for the nine months ending September 2025, up from CN¥157.14 million the previous year, alongside a net income of CN¥51.75 million compared to a loss previously. This growth marks its transition to profitability, with earnings per share improving accordingly. The company maintains financial stability with short-term assets significantly exceeding liabilities and no debt burden, although its return on equity remains low at 5%. The management team is moderately experienced; however, the board lacks seasoned members which may impact strategic direction amidst high share price volatility.
- Jump into the full analysis health report here for a deeper understanding of Shenzhen Hemei GroupLTD.
- Examine Shenzhen Hemei GroupLTD's past performance report to understand how it has performed in prior years.
Where To Now?
- Explore the 3,629 names from our Global Penny Stocks screener here.
- Ready For A Different Approach? Diversify your portfolio with solid dividend payers offering reliable income streams to weather potential market turbulence.
This article by Simply Wall St is general in nature. We provide commentary based on historical data and analyst forecasts only using an unbiased methodology and our articles are not intended to be financial advice. It does not constitute a recommendation to buy or sell any stock, and does not take account of your objectives, or your financial situation. We aim to bring you long-term focused analysis driven by fundamental data. Note that our analysis may not factor in the latest price-sensitive company announcements or qualitative material. Simply Wall St has no position in any stocks mentioned.
Have feedback on this article? Concerned about the content? Get in touch with us directly. Alternatively, email editorial-team@simplywallst.com