
 Nasdaq
 華爾街日報
華爾街日報Robinhood (HOOD): Reassessing Valuation After Prediction Market Pivot and Indonesia-Focused Global Expansion
Robinhood Markets (HOOD) just put a big exclamation point on its pivot into prediction markets and overseas growth, snapping up Indonesian assets while doubling down on event contracts that keep users coming back.
See our latest analysis for Robinhood Markets.
That strategic push comes after a huge run, with Robinhood’s share price up sharply on a year to date basis and a 3 year total shareholder return above 1,400 percent. This suggests momentum is still broadly intact despite recent choppier trading data.
If Robinhood’s moves have you thinking bigger about fintech and digital platforms, it is also worth exploring fast growing stocks with high insider ownership for other fast moving, high conviction ideas.
With revenues still climbing, analysts hiking targets, and ARK buying dips, Robinhood looks priced for perfection. The question now is whether today’s premium reflects reality or if markets still underestimate its next leg of growth.
Most Popular Narrative Narrative: 20.5% Undervalued
With the most followed narrative placing Robinhood’s fair value well above the recent 120.44 dollar close, the gap rests on aggressive long term assumptions.
The rapid growth of recurring revenue businesses such as Robinhood Gold and the expanding international user base (including through acquisitions like Bitstamp and WonderFi) are indicative of business model resilience, less sensitivity to market cyclicality, and an increasing potential for stable, high margin earnings streams.
Want to see the math behind that ambitious upside case? The narrative leans on sustained double digit growth, elevated margins, and a punchy future earnings multiple. Curious how those moving parts combine into that lofty fair value estimate? Read on to unpack the full valuation story.
Result: Fair Value of $151.55 (UNDERVALUED)
Have a read of the narrative in full and understand what's behind the forecasts.
However, sustained regulatory pushback on prediction markets, along with intensifying competition squeezing unit economics, could quickly challenge the high growth, premium valuation thesis.
Find out about the key risks to this Robinhood Markets narrative.
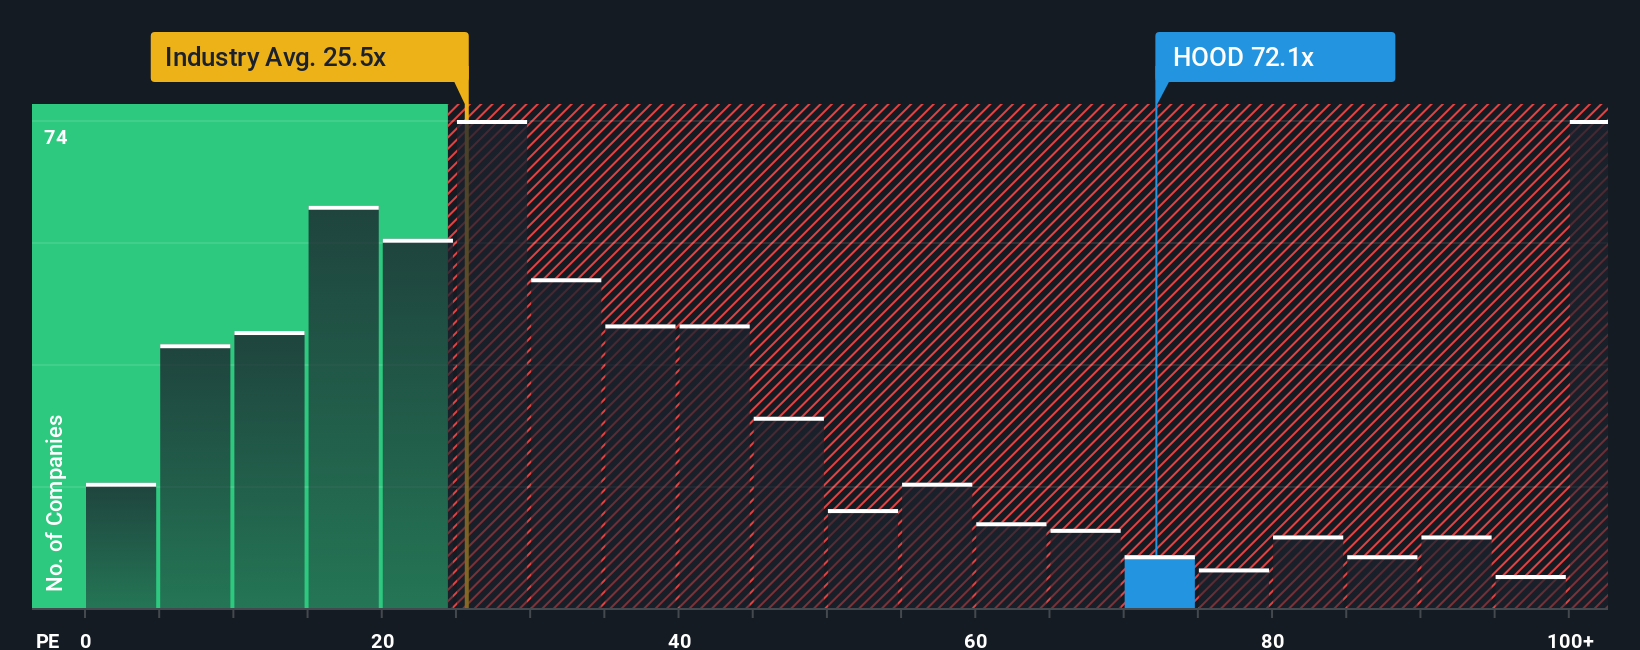
Another Way To Look At Valuation
On earnings based metrics, Robinhood looks stretched, trading on a 49.4 times price to earnings ratio versus about 25.7 times for the US capital markets sector and a 23 times peer average. Even against a 27.6 times fair ratio, the gap is wide, which raises the question of how long the market will tolerate such a premium if growth cools.
See what the numbers say about this price — find out in our valuation breakdown.
Build Your Own Robinhood Markets Narrative
If this view does not fully align with your own thinking, you can quickly dig into the numbers yourself and craft a personalized story: Do it your way.
A great starting point for your Robinhood Markets research is our analysis highlighting 3 key rewards and 2 important warning signs that could impact your investment decision.
Looking for more investment ideas?
Do not stop with Robinhood when you can upgrade your watchlist with fresh, data driven opportunities that match your strategy and could sharpen your next move.
- Capture potential mispricings by reviewing these 904 undervalued stocks based on cash flows that our models flag as trading below their estimated intrinsic value.
- Ride powerful secular trends by targeting innovation leaders through these 24 AI penny stocks shaping how software, automation, and intelligence transform entire industries.
- Strengthen your income stream by scanning these 10 dividend stocks with yields > 3% that offer attractive yields with room for sustainable, long term payouts.
This article by Simply Wall St is general in nature. We provide commentary based on historical data and analyst forecasts only using an unbiased methodology and our articles are not intended to be financial advice. It does not constitute a recommendation to buy or sell any stock, and does not take account of your objectives, or your financial situation. We aim to bring you long-term focused analysis driven by fundamental data. Note that our analysis may not factor in the latest price-sensitive company announcements or qualitative material. Simply Wall St has no position in any stocks mentioned.
Have feedback on this article? Concerned about the content? Get in touch with us directly. Alternatively, email editorial-team@simplywallst.com