
 Nasdaq
 華爾街日報
華爾街日報Reassessing W. R. Berkley’s Valuation After a Recent Share Price Pullback and Strong Multi‑Year Returns
W. R. Berkley (WRB) has been quietly reshaping its return profile, and the recent pullback is giving investors a fresh chance to reassess the insurer’s long term compounding story.
See our latest analysis for W. R. Berkley.
The recent slide in W. R. Berkley’s share price, now at $70.64 and pulling back after a strong run, sits against a solid backdrop of a 21.77 percent year to date share price return and a hefty 170.91 percent five year total shareholder return. This suggests long term momentum is still intact even as near term enthusiasm cools.
If this kind of compounding has your attention, it could be a good moment to broaden your watchlist and uncover fast growing stocks with high insider ownership.
With shares trading just below analyst targets but screens flagging a sizeable intrinsic discount, the key question now is whether W. R. Berkley is quietly undervalued or whether the market is already discounting years of future growth.
Most Popular Narrative Narrative: 4.8% Undervalued
With the narrative fair value sitting modestly above W. R. Berkley’s last close, the spotlight shifts to how durable its earnings and margins can really be.
Prudent capital management, shown by a growing investment portfolio benefitting from higher new money yields and conservative reserving, is increasing investment income and book value per share, laying a foundation for higher long-term earnings and the potential for resumed share buybacks.
Want to see what is really powering that earnings engine? The narrative quietly bakes in firmer margins, steady top line assumptions, and a future profit multiple that might surprise you. Curious how those moving parts combine into today’s fair value signal? The full narrative shows the numbers behind the story.
Result: Fair Value of $74.20 (UNDERVALUED)
Have a read of the narrative in full and understand what's behind the forecasts.
However, a softer property and casualty pricing cycle and potential underwriting missteps, especially in competitive MGA channels, could quickly chip away at that margin story.
Find out about the key risks to this W. R. Berkley narrative.
Another Angle on Valuation
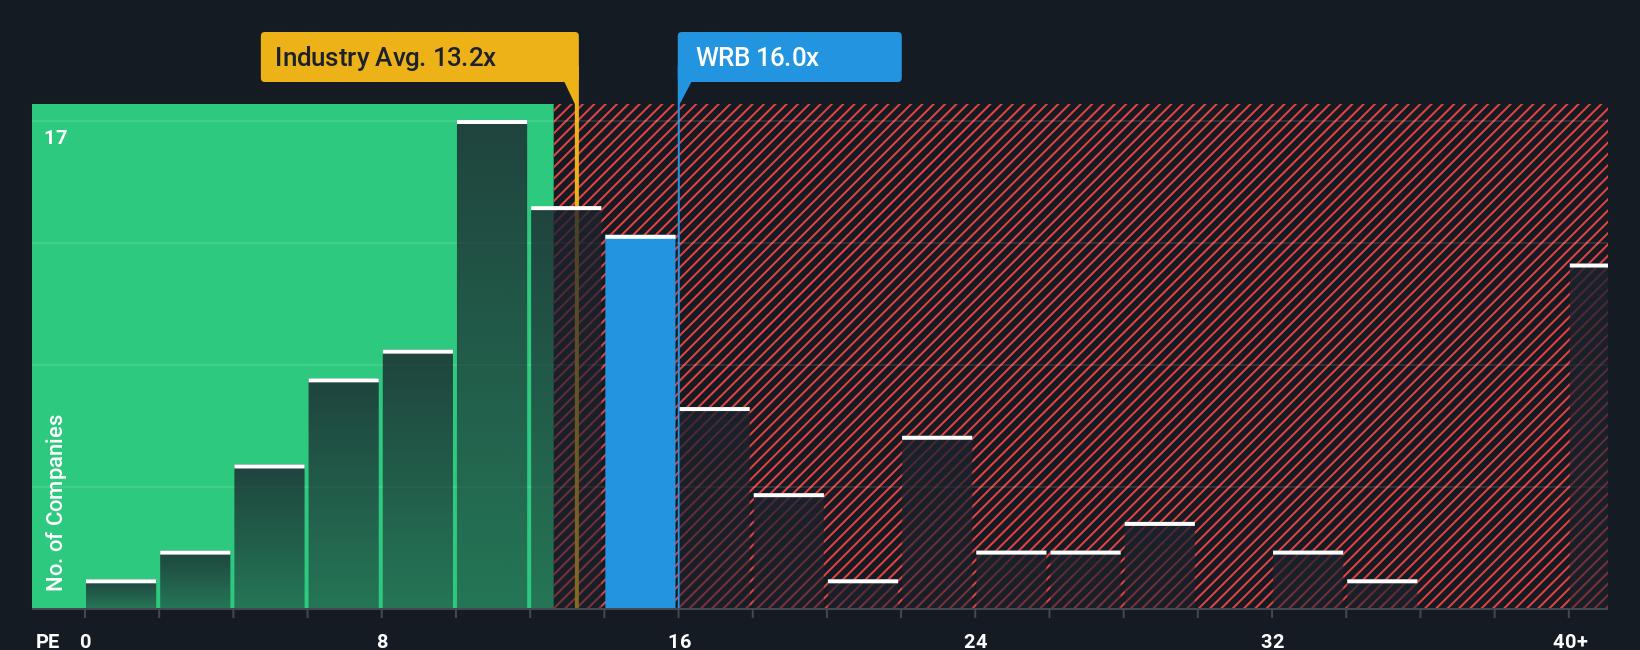
On earnings, the picture looks very different. W. R. Berkley trades on a 14.1 times price to earnings ratio, above both peers at 13.4 times and a fair ratio of 12.9 times. This hints at valuation risk if sentiment cools. Is the market paying a quality premium, or just overpaying for stability?
See what the numbers say about this price — find out in our valuation breakdown.
Build Your Own W. R. Berkley Narrative
If you see the story differently, or would rather lean on your own homework, you can build a fresh narrative in just minutes: Do it your way.
A great starting point for your W. R. Berkley research is our analysis highlighting 2 key rewards and 1 important warning sign that could impact your investment decision.
Ready for more investment ideas?
WRB might be compelling, but you will kick yourself later if you ignore other opportunities that our powerful screeners are surfacing for investors right now.
- Target potential mispricings by using these 904 undervalued stocks based on cash flows to spot companies where market pessimism looks out of step with underlying cash flows.
- Capitalize on innovation trends through these 24 AI penny stocks, focusing on businesses riding the structural shift toward artificial intelligence powered solutions.
- Strengthen your income strategy with these 10 dividend stocks with yields > 3%, zeroing in on companies offering yields above 3 percent that may complement a long term compounding portfolio.
This article by Simply Wall St is general in nature. We provide commentary based on historical data and analyst forecasts only using an unbiased methodology and our articles are not intended to be financial advice. It does not constitute a recommendation to buy or sell any stock, and does not take account of your objectives, or your financial situation. We aim to bring you long-term focused analysis driven by fundamental data. Note that our analysis may not factor in the latest price-sensitive company announcements or qualitative material. Simply Wall St has no position in any stocks mentioned.
Have feedback on this article? Concerned about the content? Get in touch with us directly. Alternatively, email editorial-team@simplywallst.com