
 Nasdaq
 華爾街日報
華爾街日報Ingram Micro Holding (INGM): Assessing Valuation After Xvantage Progress With Proofpoint
Ingram Micro Holding (NYSE:INGM) just spotlighted how Proofpoint is using its Xvantage platform to automate go to market workflows, from quote to cash, giving investors fresh insight into the company’s digital transformation engine.
See our latest analysis for Ingram Micro Holding.
That backdrop helps explain why investors have been steadily bidding the stock higher, with a year to date share price return of 12.32 percent and a 1 month share price return of 7.18 percent. The 1 year total shareholder return of 10.54 percent suggests momentum is building rather than fading.
If this kind of digital execution has your attention, it might be a good time to scan other potential winners across high growth tech and AI stocks and see what else fits your strategy.
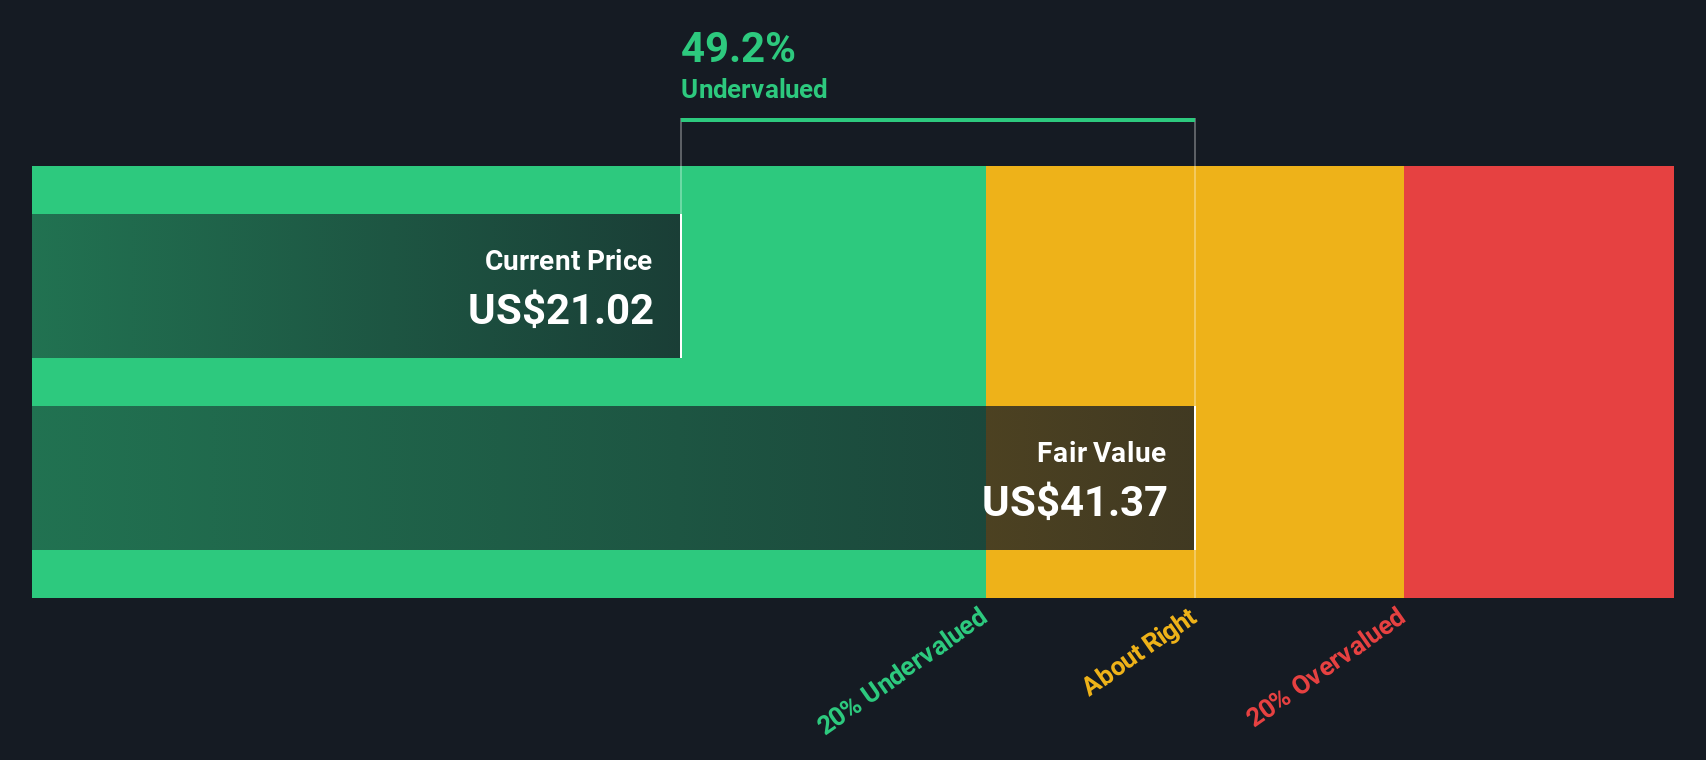
With earnings growing faster than revenue, a double digit discount to analyst targets, and a sizable gap to some intrinsic value estimates, investors now face a key question: is this a genuine buying opportunity, or is the market already pricing in future growth?
Price-to-Earnings of 18.1x: Is it justified?
On a headline basis, Ingram Micro Holding's 18.1x price to earnings multiple at a 22.24 dollar share price suggests the market is paying a moderate premium for current profits.
The price to earnings ratio compares what investors pay per share to the company’s earnings per share, making it a useful yardstick for mature, profit generating tech distributors like Ingram Micro Holding.
Here, the picture is mixed, with the stock looking good value against the broader US Electronic industry average of 24.9x, yet more expensive than its closer peer group on 15.9x, and still sitting well below an estimated fair price to earnings level of 30.6x that our models indicate the market could gravitate toward if earnings forecasts are delivered.
Against the industry benchmark, the current 18.1x multiple looks restrained compared to 24.9x, but still comfortably above peers on 15.9x, implying investors are already pricing in stronger profit growth than many direct comparables while leaving room for re rating if earnings keep compounding toward the fair 30.6x reference point.
Explore the SWS fair ratio for Ingram Micro Holding
Result: Price-to-Earnings of 18.1x (UNDERVALUED)
However, this hinges on continued margin gains and robust cloud demand, with any slowdown in enterprise IT spending or competitive pricing pressure undermining the thesis.
Find out about the key risks to this Ingram Micro Holding narrative.
Another View Using Our DCF Model
While the 18.1x earnings multiple hints at modest undervaluation, our DCF model suggests a fair value closer to 37.68 dollars, which is roughly 41 percent above today’s 22.24 dollar price. Is the market missing the story, or are the DCF assumptions too generous?
Look into how the SWS DCF model arrives at its fair value.
Simply Wall St performs a discounted cash flow (DCF) on every stock in the world every day (check out Ingram Micro Holding for example). We show the entire calculation in full. You can track the result in your watchlist or portfolio and be alerted when this changes, or use our stock screener to discover 904 undervalued stocks based on their cash flows. If you save a screener we even alert you when new companies match - so you never miss a potential opportunity.
Build Your Own Ingram Micro Holding Narrative
If you see the story differently, or simply prefer to dig into the numbers yourself, you can craft a personalized view in minutes: Do it your way.
A great starting point for your Ingram Micro Holding research is our analysis highlighting 2 key rewards and 2 important warning signs that could impact your investment decision.
Ready for your next investment move?
Do not stop at a single opportunity. Sharpen your edge with targeted stock ideas from the Simply Wall St Screener before the market prices them in.
- Capitalize on overlooked value by scanning these 904 undervalued stocks based on cash flows that combine beaten down prices with solid cash flow potential.
- Ride the next wave of intelligent automation by hunting through these 24 AI penny stocks positioned to benefit from accelerating demand for AI solutions.
- Lock in potential income streams by reviewing these 10 dividend stocks with yields > 3% that pair attractive yields with balance sheets built to sustain payouts.
This article by Simply Wall St is general in nature. We provide commentary based on historical data and analyst forecasts only using an unbiased methodology and our articles are not intended to be financial advice. It does not constitute a recommendation to buy or sell any stock, and does not take account of your objectives, or your financial situation. We aim to bring you long-term focused analysis driven by fundamental data. Note that our analysis may not factor in the latest price-sensitive company announcements or qualitative material. Simply Wall St has no position in any stocks mentioned.
Have feedback on this article? Concerned about the content? Get in touch with us directly. Alternatively, email editorial-team@simplywallst.com