
 Nasdaq
 華爾街日報
華爾街日報Has Amex’s Premium Card Momentum Pushed the Stock Too Far in 2025?
- If you are wondering whether American Express is still attractive after such a strong run, or if you might be late to the party, this section will walk through what the market is really pricing in.
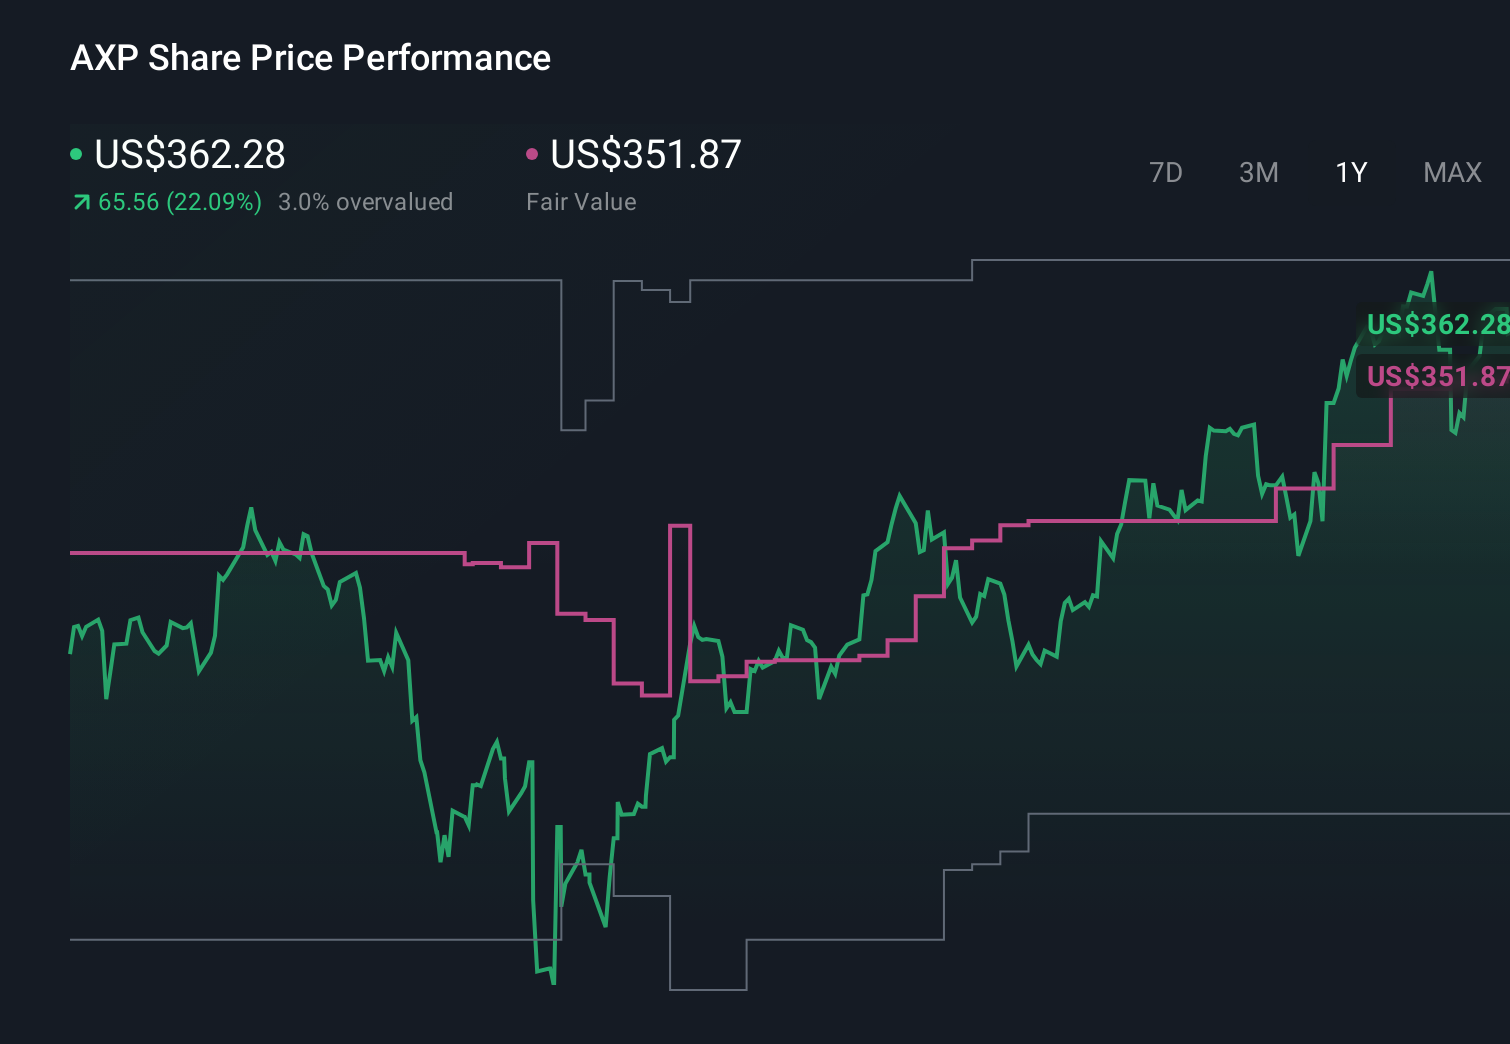
- The stock has climbed 2.0% over the last week, 7.6% over the past month, and is up 28.4% year to date, building on gains of 27.6% over 1 year, 176.1% over 3 years, and 241.2% over 5 years.
- Recent headlines have focused on American Express cementing its premium cardholder base and expanding co branded partnerships, reinforcing the narrative that its franchise is still gaining pricing power. At the same time, analysts have been revisiting their long term growth assumptions as travel and experiential spending trends stay resilient, which helps explain why the stock has continued to move higher.
- Despite that momentum, American Express only scores 1 out of 6 on our valuation checks. By our framework it looks undervalued in just one area, which raises a few important questions about how the market is valuing this business. Next we will break down the different valuation approaches behind that score, and later we will look at an even more useful way to think about American Express s true worth beyond any single metric.
American Express scores just 1/6 on our valuation checks. See what other red flags we found in the full valuation breakdown.
Approach 1: American Express Excess Returns Analysis
The Excess Returns model asks a simple question: how much profit can American Express generate above the minimum return shareholders demand on their equity, and for how long? Instead of focusing on near term earnings, it looks at the value created each year over and above the company’s cost of equity.
For American Express, the starting point is a Book Value of $47.05 per share and a Stable EPS of $18.45 per share, based on weighted future Return on Equity estimates from 13 analysts. With a Cost of Equity of $4.26 per share, the Excess Return comes to $14.19 per share, supported by a robust average Return on Equity of 36.34%. Analysts also see Stable Book Value rising to $50.76 per share, based on forecasts from 9 analysts.
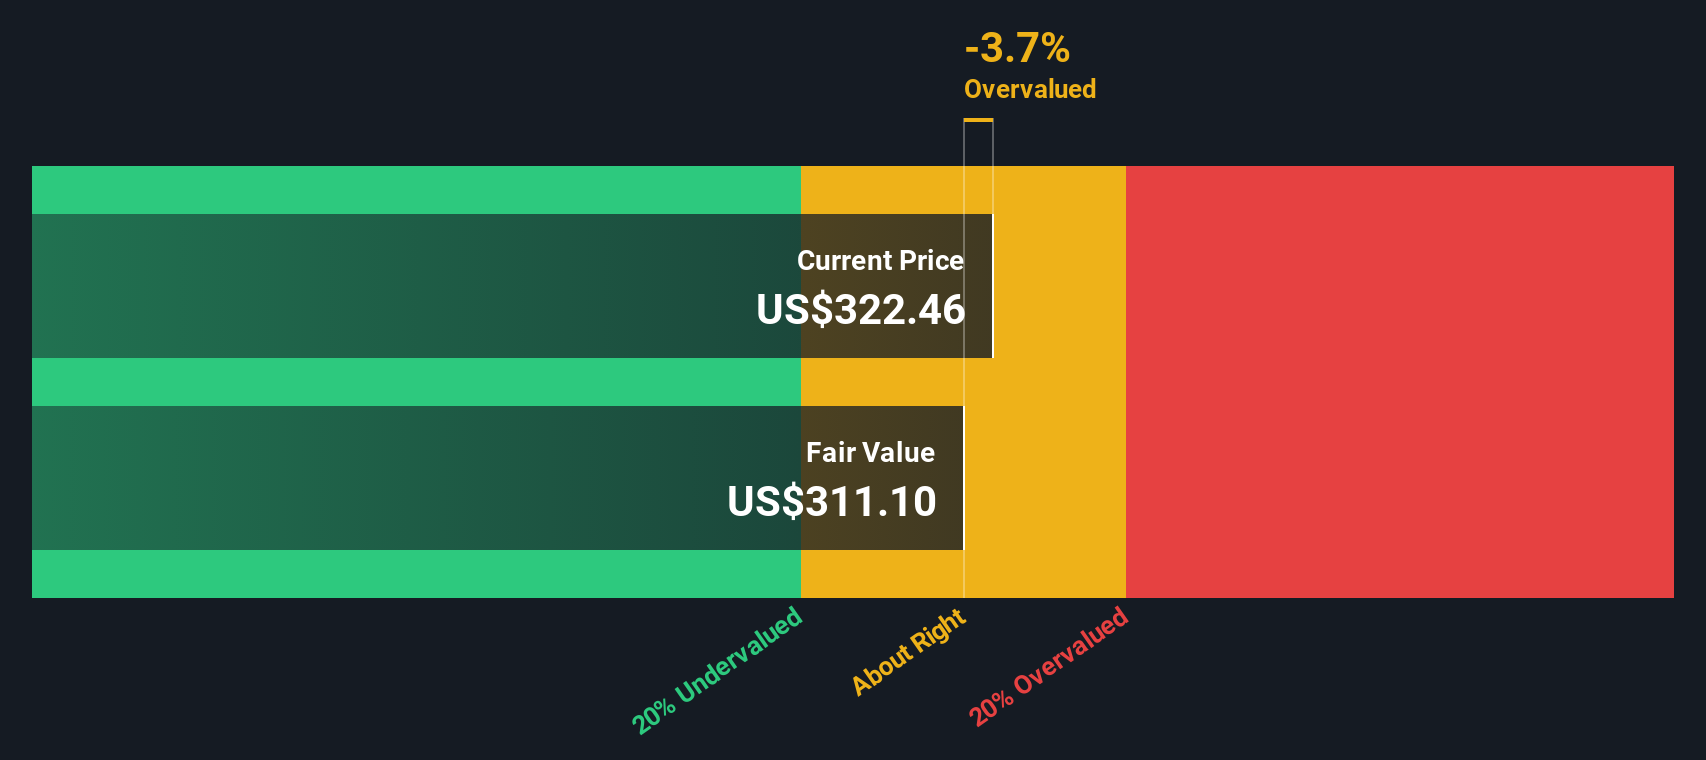
Combining these inputs, the Excess Returns model produces an intrinsic value of about $326.94 per share. That implies American Express is roughly 17.2% overvalued at the current market price and suggests the market is already paying up for its strong profitability.
Result: OVERVALUED
Our Excess Returns analysis suggests American Express may be overvalued by 17.2%. Discover 904 undervalued stocks or create your own screener to find better value opportunities.
Approach 2: American Express Price vs Earnings
For a mature, highly profitable company like American Express, the price to earnings ratio is a useful way to judge valuation because it directly links what investors pay to the cash generating power of the business today.
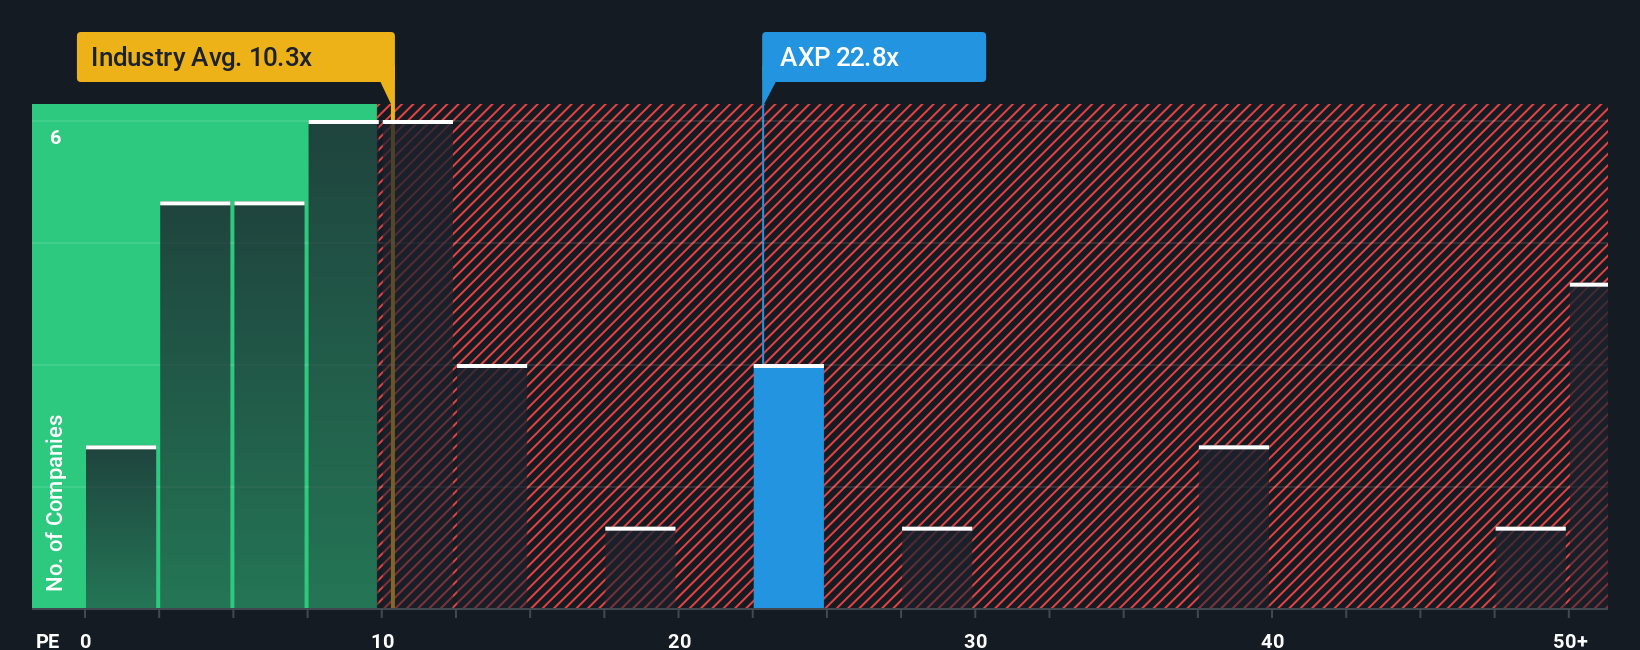
In general, faster earnings growth and lower perceived risk justify a higher PE ratio, while slower growth or higher risk pull that multiple down to a more conservative level. At the moment, American Express trades on about 25.3x earnings, which is well above the Consumer Finance industry average of around 10.0x, but a touch below the peer group average of roughly 27.2x.
Simply Wall St also calculates a Fair Ratio of 19.8x for American Express, which is the PE multiple the company would typically command given its earnings growth outlook, profitability, industry, market value and risk profile. This Fair Ratio is more informative than a simple comparison with peers or the sector because it adjusts for the specific strengths and risks in American Express financials rather than assuming all companies deserve the same multiple. With the current PE sitting meaningfully above the 19.8x Fair Ratio, the stock screens as expensive on this measure.
Result: OVERVALUED
PE ratios tell one story, but what if the real opportunity lies elsewhere? Discover 1460 companies where insiders are betting big on explosive growth.
Upgrade Your Decision Making: Choose your American Express Narrative
Earlier we mentioned that there is an even better way to understand valuation, so let us introduce you to Narratives, which are simply the story you believe about a company, translated into a set of numbers like fair value, future revenue, earnings and margins. On Simply Wall St’s Community page, Narratives give you an accessible way to link American Express strategic story, for example premium card momentum or travel slowdown, to a financial forecast and then to an explicit Fair Value that you can compare with today’s Price to help frame whether you see it as a buy, hold, or sell. Because Narratives update dynamically as fresh news, earnings and guidance come in, they stay in sync with what is actually happening rather than a static spreadsheet saved months ago. For American Express right now, some investors are comfortable with a fair value closer to about $366 per share while more cautious investors lean toward roughly $230, and Narratives make those differences in assumptions about growth, margins, and risks transparent so you can quickly see which view is closest to your own.
Do you think there's more to the story for American Express? Head over to our Community to see what others are saying!
This article by Simply Wall St is general in nature. We provide commentary based on historical data and analyst forecasts only using an unbiased methodology and our articles are not intended to be financial advice. It does not constitute a recommendation to buy or sell any stock, and does not take account of your objectives, or your financial situation. We aim to bring you long-term focused analysis driven by fundamental data. Note that our analysis may not factor in the latest price-sensitive company announcements or qualitative material. Simply Wall St has no position in any stocks mentioned.
Have feedback on this article? Concerned about the content? Get in touch with us directly. Alternatively, email editorial-team@simplywallst.com