
 Nasdaq
 華爾街日報
華爾街日報Does Kyndryl Still Offer Value After Its Multi Year Rebound and AI Cloud Deals?
- If you are wondering whether Kyndryl Holdings at around $27 a share still offers value after a big multi year rebound, you are not alone. This breakdown is designed to cut through the noise for you.
- The stock is up 1.9% over the last week and 11.9% over the last month, but it is still down 23.2% year to date and 22.0% over the past year, even after a striking 157.8% gain over three years.
- Recent headlines have focused on Kyndryl deepening its cloud and AI partnerships and winning large scale infrastructure transformation contracts. This helps explain why sentiment has improved despite the stock still trading below recent highs. The market is slowly repricing the business as a more focused, higher margin IT infrastructure and services player rather than just an IBM spin off in run off mode.
- On our numbers, Kyndryl scores a 5 out of 6 valuation check score, suggesting the market may be undervaluing several aspects of its cash flows and assets. In the rest of this article we will walk through those valuation lenses before finishing with a more intuitive way to think about what the stock might really be worth.
Find out why Kyndryl Holdings's -22.0% return over the last year is lagging behind its peers.
Approach 1: Kyndryl Holdings Discounted Cash Flow (DCF) Analysis
A Discounted Cash Flow model estimates what a company is worth by projecting the cash it can generate in the future and then discounting those cash flows back to today in dollar terms.
For Kyndryl Holdings, the latest twelve month Free Cash Flow is about $249 million. Using a 2 Stage Free Cash Flow to Equity model, analyst estimates and extrapolated projections see FCF rising steadily, reaching over $2.0 billion by 2035 as margins and scale improve.
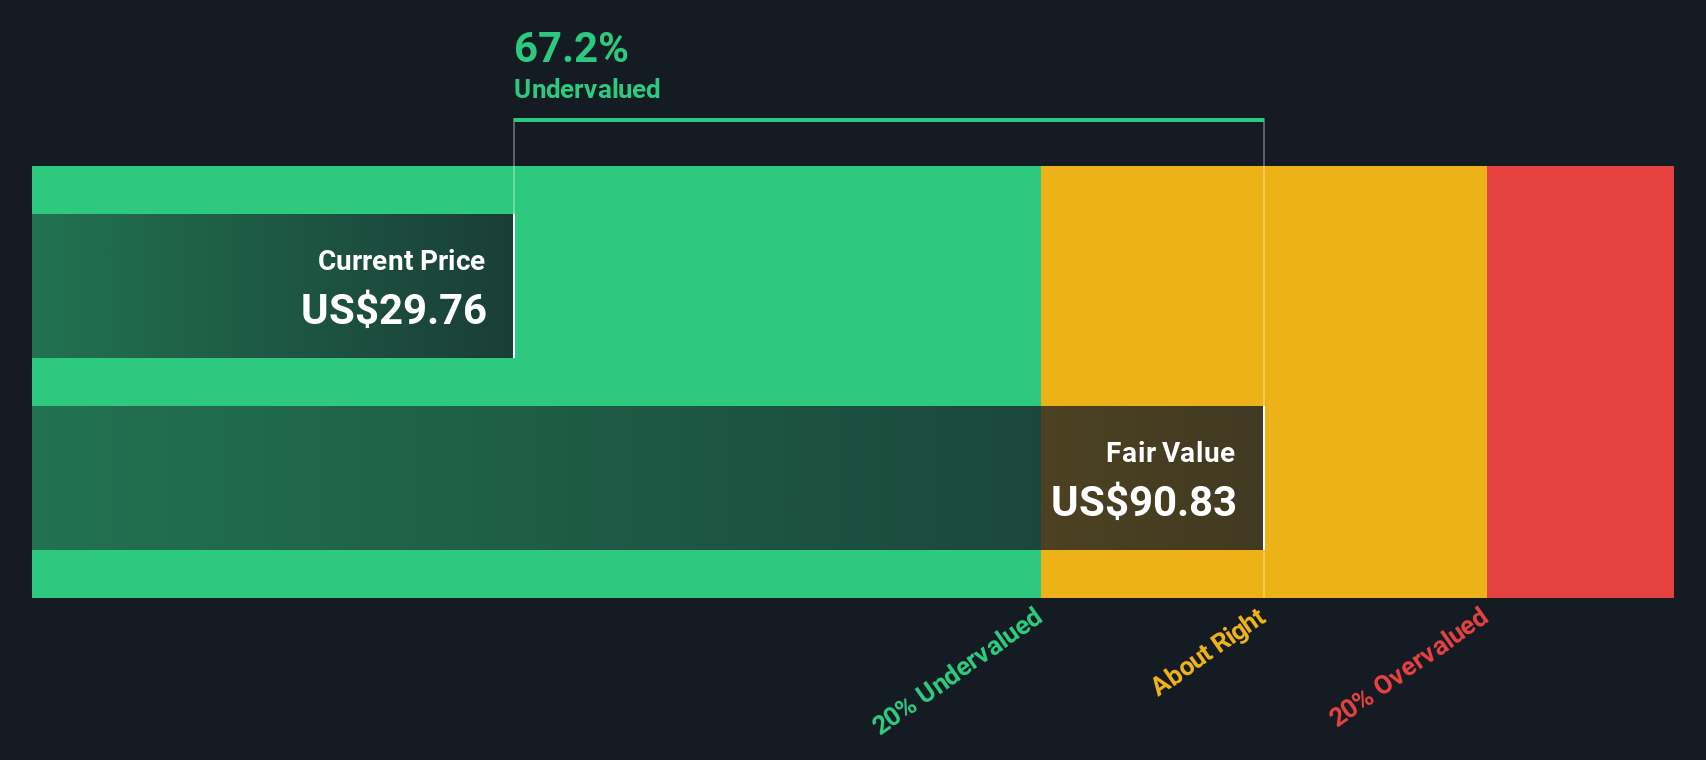
When all those projected cash flows are discounted back to today, the intrinsic value comes out at roughly $74.81 per share. Compared with the current price near $27, the DCF implies the shares are about 63.5% undervalued, suggesting the market is not yet fully pricing in Kyndryl future cash generation potential.
Result: UNDERVALUED
Our Discounted Cash Flow (DCF) analysis suggests Kyndryl Holdings is undervalued by 63.5%. Track this in your watchlist or portfolio, or discover 904 more undervalued stocks based on cash flows.
Approach 2: Kyndryl Holdings Price vs Earnings
For profitable companies like Kyndryl, the Price to Earnings (PE) ratio is a useful lens because it directly relates what investors are paying today to the profits the business is already generating. In general, faster growth and lower perceived risk justify a higher PE multiple, while slower growth or higher uncertainty usually warrant a lower one.
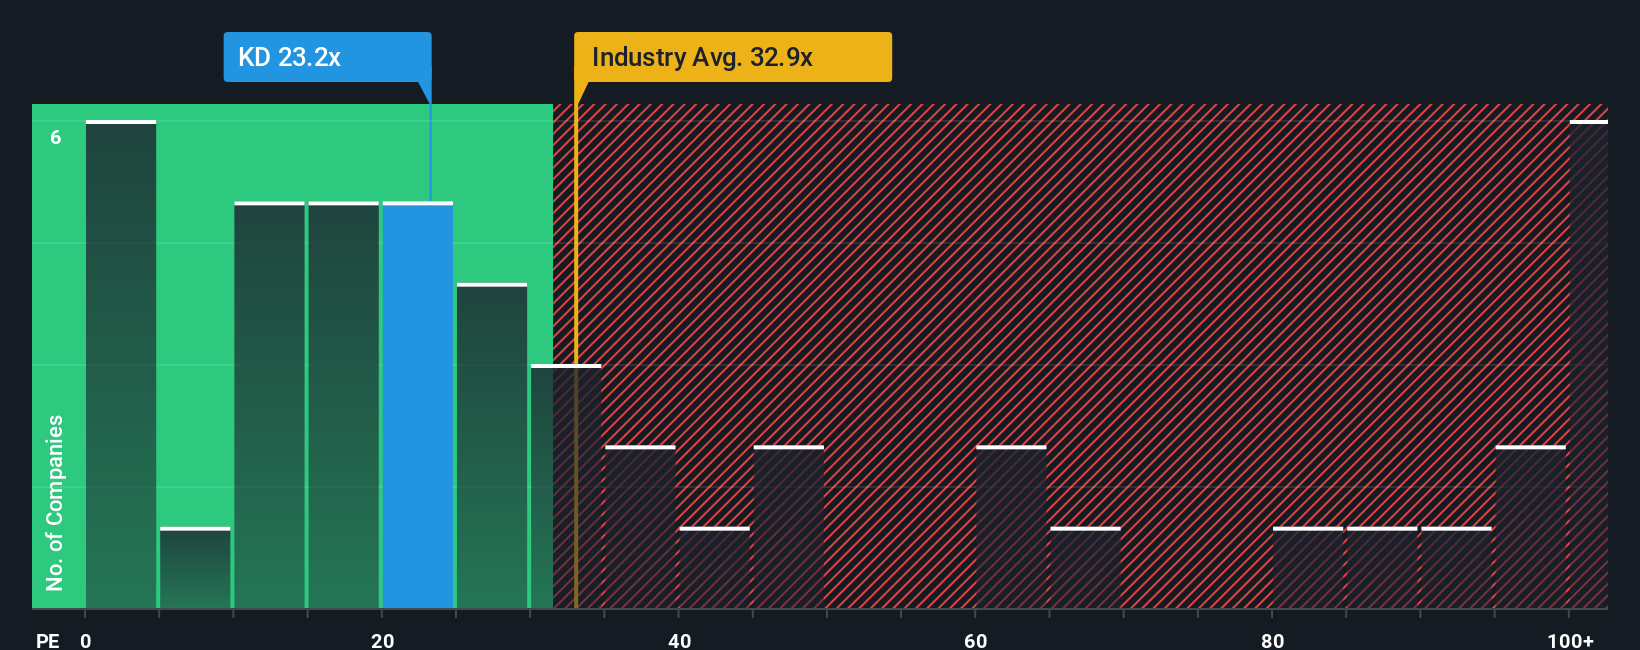
Kyndryl currently trades on roughly 15.28x earnings. That is below the peer average of about 17.49x and well under the broader IT industry average of around 29.36x, which on the surface suggests a discount relative to both direct competitors and the wider sector. However, simple comparisons can miss nuances such as company specific growth prospects, margins and risk profile.
Simply Wall St captures those factors in a proprietary “Fair Ratio,” which estimates the PE multiple a company ought to trade on given its earnings growth, profitability, industry, market cap and risk characteristics. For Kyndryl, this Fair Ratio is 41.31x, materially above the current 15.28x. That gap implies the market is pricing Kyndryl well below what its fundamentals might justify, even after recent share price gains.
Result: UNDERVALUED
PE ratios tell one story, but what if the real opportunity lies elsewhere? Discover 1460 companies where insiders are betting big on explosive growth.
Upgrade Your Decision Making: Choose your Kyndryl Holdings Narrative
Earlier we mentioned that there is an even better way to understand valuation, so let us introduce Narratives, a simple way to connect your view of the Kyndryl story with the numbers behind its future revenue, earnings, margins and ultimately what you believe is a fair value per share.
A Narrative on Simply Wall St is your own story for a company that ties together how you think its business will evolve, the financial forecast that follows from that view, and the fair value that drops out at the end.
Within the Community page on Simply Wall St, millions of investors use Narratives as an easy, guided tool to set assumptions, see the resulting fair value, and then compare that to today’s price to decide whether Kyndryl looks like a buy, a hold or a sell for them.
Because Narratives are dynamically updated when new information such as earnings results, contract wins or technology announcements arrive, your fair value view can evolve in real time rather than being a static, one-off calculation.
For example, one Kyndryl Narrative might lean into Quantum Safe services and agentic AI, backing a fair value around 55 dollars. Meanwhile, a more cautious Narrative focused on legacy contract risks could land closer to 40 dollars, showing how different but reasonable stories can lead to very different conclusions about what the stock is worth today.
Do you think there's more to the story for Kyndryl Holdings? Head over to our Community to see what others are saying!

This article by Simply Wall St is general in nature. We provide commentary based on historical data and analyst forecasts only using an unbiased methodology and our articles are not intended to be financial advice. It does not constitute a recommendation to buy or sell any stock, and does not take account of your objectives, or your financial situation. We aim to bring you long-term focused analysis driven by fundamental data. Note that our analysis may not factor in the latest price-sensitive company announcements or qualitative material. Simply Wall St has no position in any stocks mentioned.
Have feedback on this article? Concerned about the content? Get in touch with us directly. Alternatively, email editorial-team@simplywallst.com