
 Nasdaq
 華爾街日報
華爾街日報Has the Market Re‑Rated GM Enough After Its 61% 2025 Rally?
How Has General Motors Performed Recently?
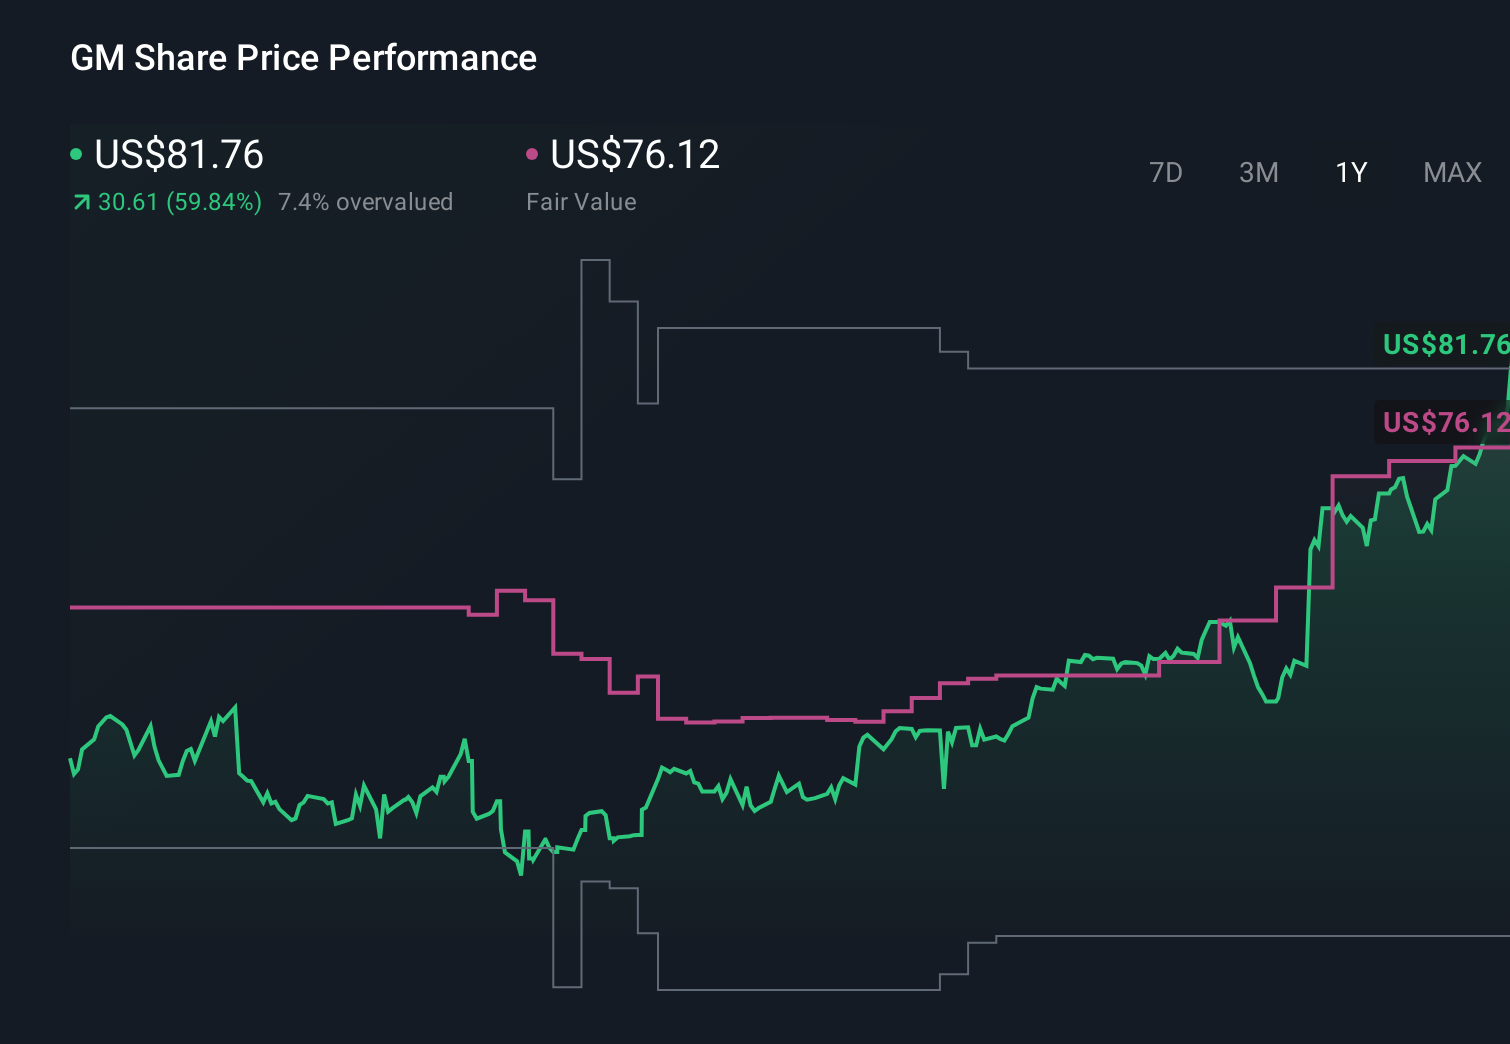
Before digging into whether General Motors looks cheap or expensive today, it helps to understand how the market has treated the stock over different time frames. GM has moved well beyond the narrative of being just a classic Detroit automaker, and its recent performance reflects shifting expectations about its future.
Over the very short term, GM shares have continued to grind higher, rising 2.9% over the last week and 16.7% in the past month. Those moves build on a strong run this year, with the stock up 61.3% year to date.
Looking further back, the story is similar, but even more pronounced. Investors who have held GM for the last year have seen a 56.5% gain, while three year and five year returns stand at 162.9% and 105.3% respectively. This shows that the stock has already been rerated quite meaningfully.
This performance backdrop matters when we turn to valuation, because a big part of the question now is whether the fundamentals have improved enough to justify these gains. With GM already delivering triple digit returns over multi year periods, the bar for future upside is naturally higher. That makes a disciplined valuation check even more important.
Approach 1: General Motors Discounted Cash Flow (DCF) Analysis
A Discounted Cash Flow, or DCF, model estimates what a company is worth by projecting the cash it can generate in the future and then discounting those cash flows back to today in dollar terms.
For General Motors, the model uses a 2 Stage Free Cash Flow to Equity approach. GM generated roughly $13.4 billion of free cash flow over the last twelve months, and analyst forecasts, supplemented by Simply Wall St extrapolations, see annual free cash flows remaining robust and gradually rising toward around $11.0 billion by 2035. These projections reflect a steady, moderate growth path rather than aggressive expansion.
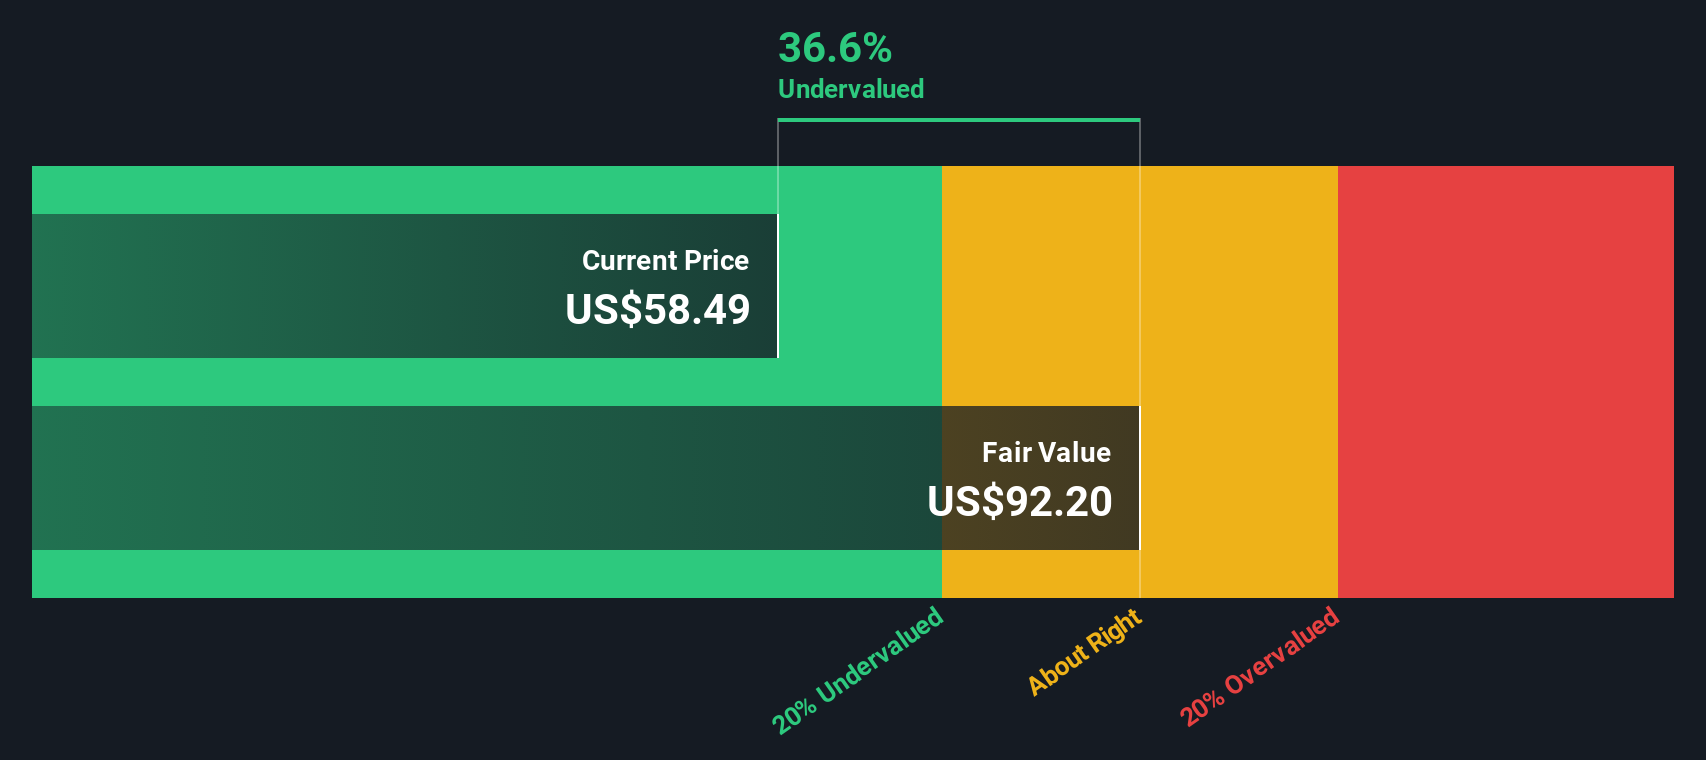
When all those future cash flows are discounted back to the present, the DCF model arrives at an intrinsic value of about $97.40 per share. Compared with the current share price, this implies the stock is trading at roughly a 14.9% discount, suggesting that the market is not fully pricing in GM's expected cash generation.
Result: UNDERVALUED
Our Discounted Cash Flow (DCF) analysis suggests General Motors is undervalued by 14.9%. Track this in your watchlist or portfolio, or discover 904 more undervalued stocks based on cash flows.
Approach 2: General Motors Price vs Earnings
For profitable companies like General Motors, the price to earnings, or PE, ratio is a straightforward way to gauge how much investors are willing to pay for each dollar of current profits. It connects directly to the bottom line that ultimately funds dividends, buybacks and reinvestment.
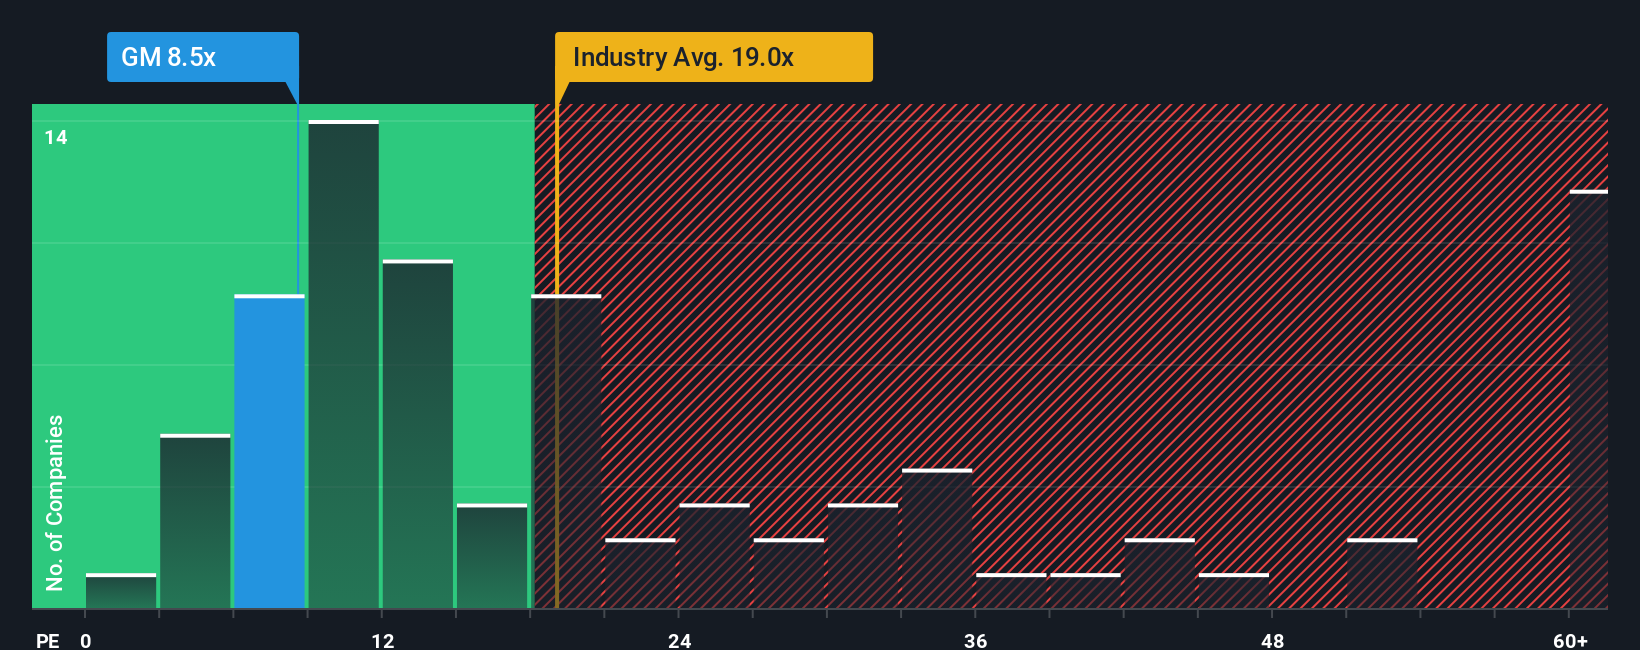
What counts as a normal PE depends on how fast earnings are expected to grow and how risky those earnings are. Higher growth and more predictable profits usually justify a higher PE, while slower or more volatile earnings deserve a lower one. GM currently trades on a PE of about 16.2x, which sits below the broader Auto industry average of roughly 18.3x and well under the peer group average of around 22.5x.
Simply Wall St also calculates a Fair Ratio, a proprietary estimate of the PE that GM should trade on given its growth outlook, profitability, industry, size and risk profile. This can be more informative than a simple peer or industry comparison because it tailors the benchmark to GM’s specific fundamentals. GM’s Fair Ratio is about 20.7x, comfortably above its current 16.2x multiple, which suggests the shares may be undervalued on an earnings basis.
Result: UNDERVALUED
PE ratios tell one story, but what if the real opportunity lies elsewhere? Discover 1460 companies where insiders are betting big on explosive growth.
Upgrade Your Decision Making: Choose your General Motors Narrative
Earlier we mentioned that there is an even better way to understand valuation, so let us introduce you to Narratives, a simple framework that lets you attach a clear story about a company’s future to the numbers behind its fair value, such as your assumptions for revenue, earnings and margins. A Narrative links what you believe about GM’s strategy, competitive position and risks to a concrete financial forecast and then to a fair value estimate that you can compare directly with today’s share price to help inform whether you view it as a potential buy, hold or sell. On Simply Wall St’s Community page, used by millions of investors, Narratives are easy to create, browse and refine, and they update dynamically as new information such as earnings, tariffs or EV news comes in, so your view stays current. For example, one GM Narrative might lean bullish with a fair value near $80 per share based on strong software and margin expansion, while a more cautious Narrative could anchor closer to $38, reflecting concerns about EV demand, tariffs and capital intensity. The platform makes both perspectives transparent so you can see which assumptions you agree with.
Do you think there's more to the story for General Motors? Head over to our Community to see what others are saying!
This article by Simply Wall St is general in nature. We provide commentary based on historical data and analyst forecasts only using an unbiased methodology and our articles are not intended to be financial advice. It does not constitute a recommendation to buy or sell any stock, and does not take account of your objectives, or your financial situation. We aim to bring you long-term focused analysis driven by fundamental data. Note that our analysis may not factor in the latest price-sensitive company announcements or qualitative material. Simply Wall St has no position in any stocks mentioned.
Have feedback on this article? Concerned about the content? Get in touch with us directly. Alternatively, email editorial-team@simplywallst.com