
 Nasdaq
 華爾街日報
華爾街日報Does Zoetis’ Recent 22.8% Share Price Slide Signal a Long Term Opportunity?
- If you have been wondering whether Zoetis is starting to look like a bargain or just a value trap in the making, you are not alone. This article will unpack what the current price is really telling us.
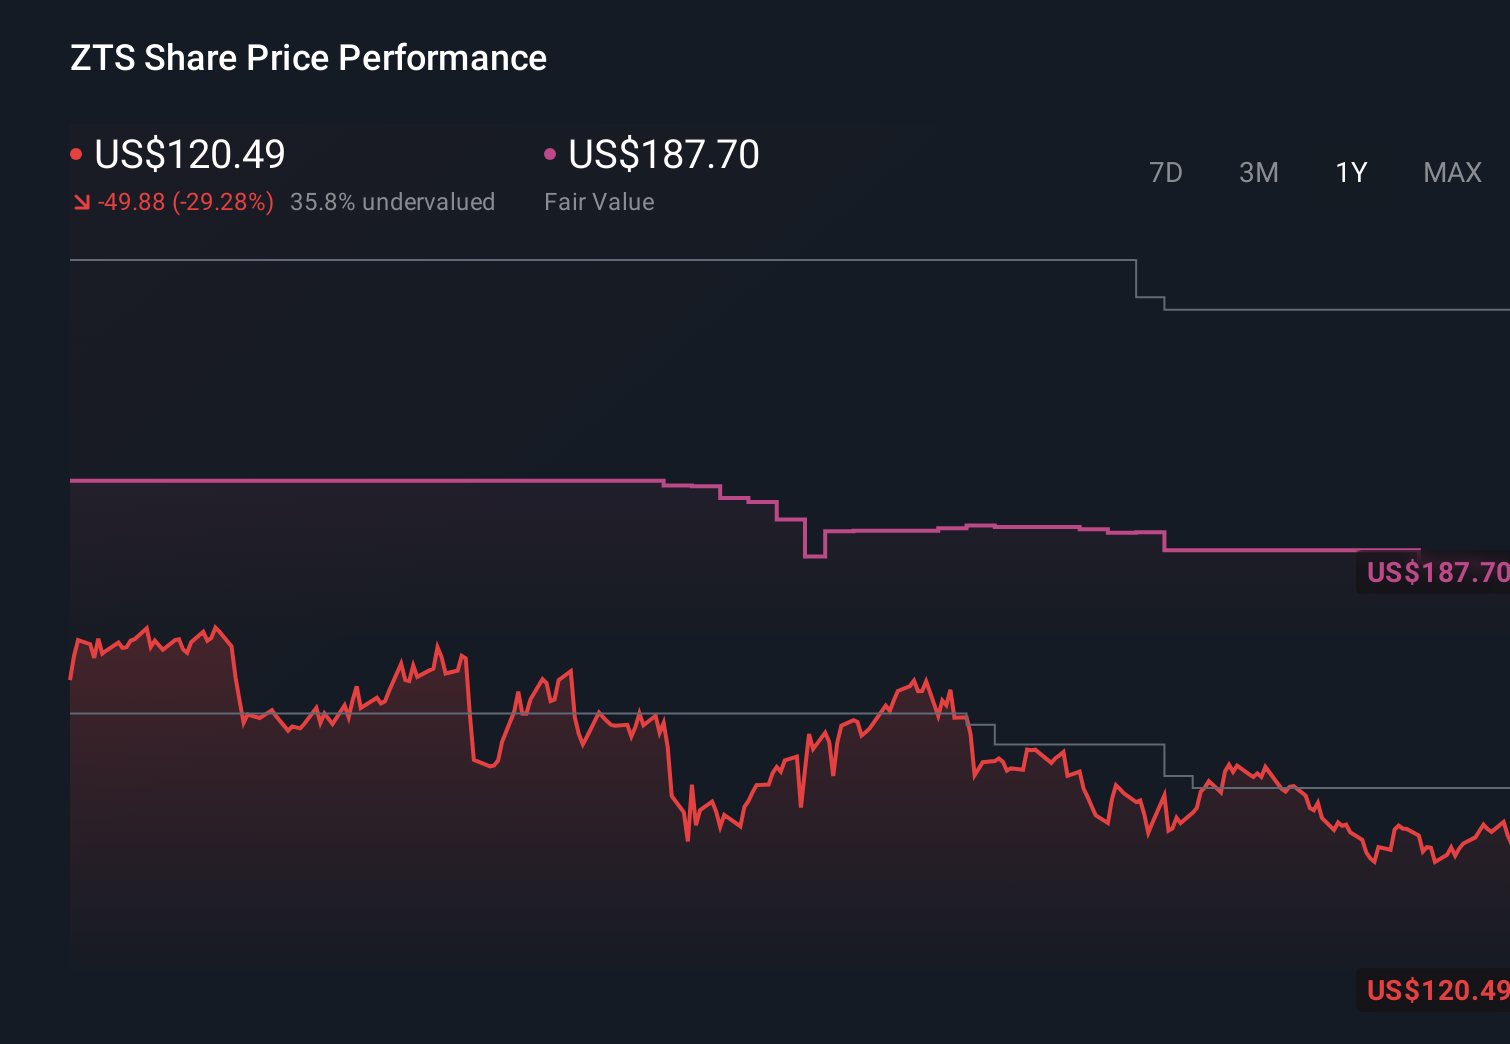
- Despite being down about 22.8% over the last year and year to date, Zoetis has shown a modest bounce recently, with the share price up 2.7% over the past week and 2.1% over the past month, hinting that sentiment might be stabilizing.
- Investors have been reacting to a mix of headlines around the long term demand for pet care and livestock health solutions, alongside broader debates about how much premium to pay for high quality animal health franchises. At the same time, sector wide rotations away from defensives toward growth and cyclicals have weighed on many healthcare names, giving valuation focused investors more to consider.
- Right now Zoetis scores a solid 5/6 on our valuation checks. This suggests it screens as undervalued on most of the metrics we track. Next, we will break down what those different approaches say about its fair value, before exploring an even more nuanced way to think about valuation at the end of the article.
Find out why Zoetis's -22.8% return over the last year is lagging behind its peers.
Approach 1: Zoetis Discounted Cash Flow (DCF) Analysis
A Discounted Cash Flow model estimates what a company is worth by projecting the cash it can generate in the future and then discounting those cash flows back to today in dollar terms.
For Zoetis, the latest twelve month Free Cash Flow stands at about $2.2 billion. Analysts expect this to rise steadily, with Simply Wall St combining analyst estimates for the next few years and then extrapolating beyond that. On this basis, projected Free Cash Flow reaches roughly $3.9 billion by 2035, reflecting healthy mid single digit annual growth over the coming decade.
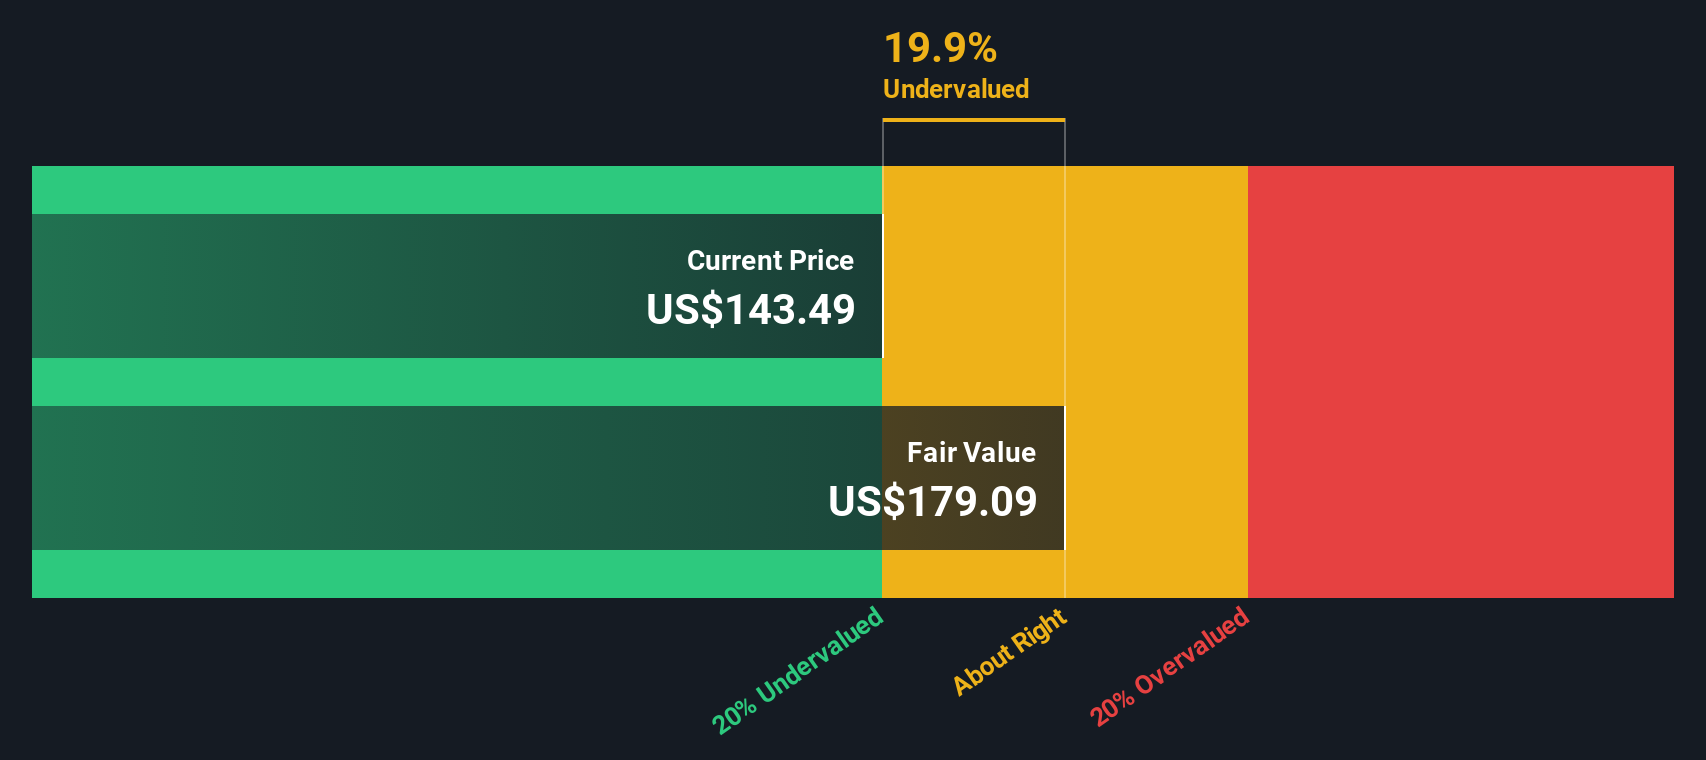
Using a 2 Stage Free Cash Flow to Equity model, these future cash flows are discounted back to today, giving an estimated intrinsic value of $177.71 per share. Compared to the current market price, this implies Zoetis is trading at roughly a 29.4% discount, suggesting the stock is meaningfully undervalued if these cash flow assumptions prove accurate.
Result: UNDERVALUED
Our Discounted Cash Flow (DCF) analysis suggests Zoetis is undervalued by 29.4%. Track this in your watchlist or portfolio, or discover 904 more undervalued stocks based on cash flows.
Approach 2: Zoetis Price vs Earnings
For a profitable, established business like Zoetis, the Price to Earnings ratio is a straightforward way to gauge how much investors are willing to pay for each dollar of current earnings. The higher the expected growth and the lower the perceived risk, the more reasonable it is to see a higher PE ratio, while slower or riskier earnings generally warrant a lower multiple.
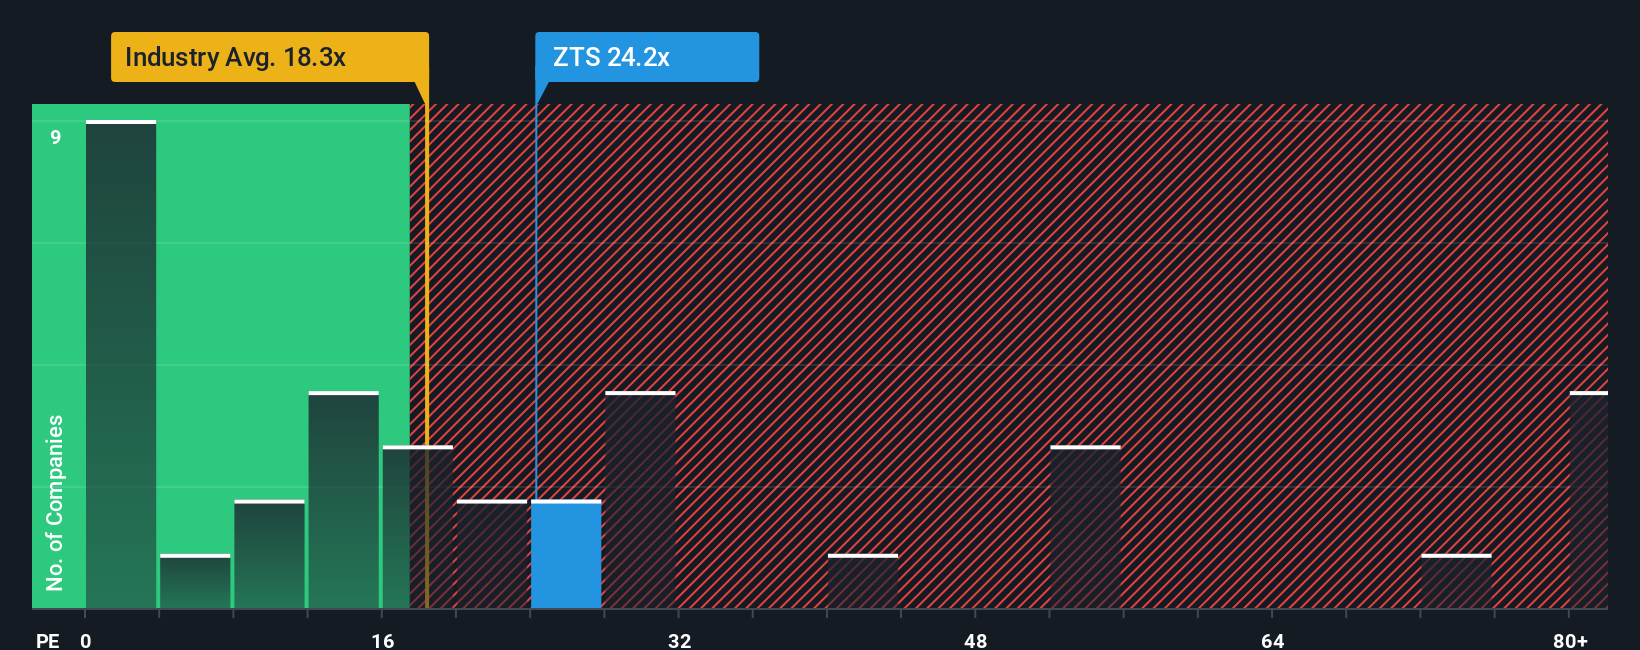
Zoetis currently trades on a PE of about 20.9x, which is slightly above the wider Pharmaceuticals industry average of roughly 19.7x, but below the 26.5x average of closer peers. Simply Wall St also calculates a Fair Ratio of around 24.8x, a proprietary view of what multiple Zoetis should trade on after considering its earnings growth outlook, profitability, risk profile, industry and market capitalization.
This Fair Ratio is more tailored than a simple peer or industry comparison because it adjusts for Zoetis specific strengths and risks rather than assuming all pharma names deserve the same valuation. With the stock trading at 20.9x versus a Fair Ratio of 24.8x, Zoetis screens as modestly undervalued on this PE based approach.
Result: UNDERVALUED
PE ratios tell one story, but what if the real opportunity lies elsewhere? Discover 1460 companies where insiders are betting big on explosive growth.
Upgrade Your Decision Making: Choose your Zoetis Narrative
Earlier we mentioned that there is an even better way to understand valuation, so let us introduce you to Narratives, a simple way to connect your view of Zoetis with a concrete forecast and fair value on Simply Wall St.
A Narrative is your story for the company, where you spell out how you think Zoetis will grow its revenue, earnings and margins, and the platform then translates that story into a financial forecast and a Fair Value that you can compare to today’s share price.
Because Narratives live inside the Simply Wall St Community page, are easy to set up and are used by millions of investors, you can quickly see how different assumptions and viewpoints stack up without needing a spreadsheet.
They also update dynamically as new information like earnings releases, guidance changes or major news hits the market, so your Fair Value view evolves with the story rather than going stale.
For Zoetis, for example, a more bullish Narrative might focus on analyst targets nearer to $230.00 with expectations of strong innovation and margin expansion. In contrast, a more cautious Narrative might sit closer to $153.00, with assumptions that competitive pressures and slower product adoption persist.
Do you think there's more to the story for Zoetis? Head over to our Community to see what others are saying!
This article by Simply Wall St is general in nature. We provide commentary based on historical data and analyst forecasts only using an unbiased methodology and our articles are not intended to be financial advice. It does not constitute a recommendation to buy or sell any stock, and does not take account of your objectives, or your financial situation. We aim to bring you long-term focused analysis driven by fundamental data. Note that our analysis may not factor in the latest price-sensitive company announcements or qualitative material. Simply Wall St has no position in any stocks mentioned.
Have feedback on this article? Concerned about the content? Get in touch with us directly. Alternatively, email editorial-team@simplywallst.com