
 Nasdaq
 華爾街日報
華爾街日報Is It Too Late To Consider Sprott After Its 119% 2025 Surge?
- If you are wondering whether Sprott is still worth buying after its huge run, or if the smarter move is to wait for a better entry price, this article is for you.
- Sprott has been on a tear lately, climbing 7.7% in the last week, 11.5% over the past month, and a staggering 119.0% year to date. It is up 130.1% over the last year and 323.6% over five years. These strong gains naturally raise questions about how much upside is left versus the risk of a pullback.
- Recent market enthusiasm around precious metals and resource related assets has pulled more attention toward Sprott, as investors look for specialized ways to gain exposure to themes like gold, uranium, and broader commodities. At the same time, flows into thematic and alternative asset managers have added fuel to the story and help explain why the stock has rerated so aggressively.
- Despite all that excitement, Sprott currently scores 0/6 on our valuation checks, as it does not screen as undervalued on any of the six metrics in our valuation score. Next, we will unpack the usual valuation approaches and, by the end of this article, explore a more nuanced way to think about what the market might really be pricing in.
Sprott scores just 0/6 on our valuation checks. See what other red flags we found in the full valuation breakdown.
Approach 1: Sprott Excess Returns Analysis
The Excess Returns model estimates what Sprott is worth by asking how much value it can create above its cost of equity, based on its historical profitability and book value per share.
For Sprott, the model starts with a Book Value of CA$13.37 per share and a Stable Book Value of CA$12.10 per share, both anchored in the median figures from the past five years. Using an Average Return on Equity of 12.95%, the model derives a Stable EPS of CA$1.57 per share. Against a Cost of Equity of CA$0.86 per share, this translates into an Excess Return of about CA$0.71 per share, which indicates the company has been generating value on top of its funding costs.
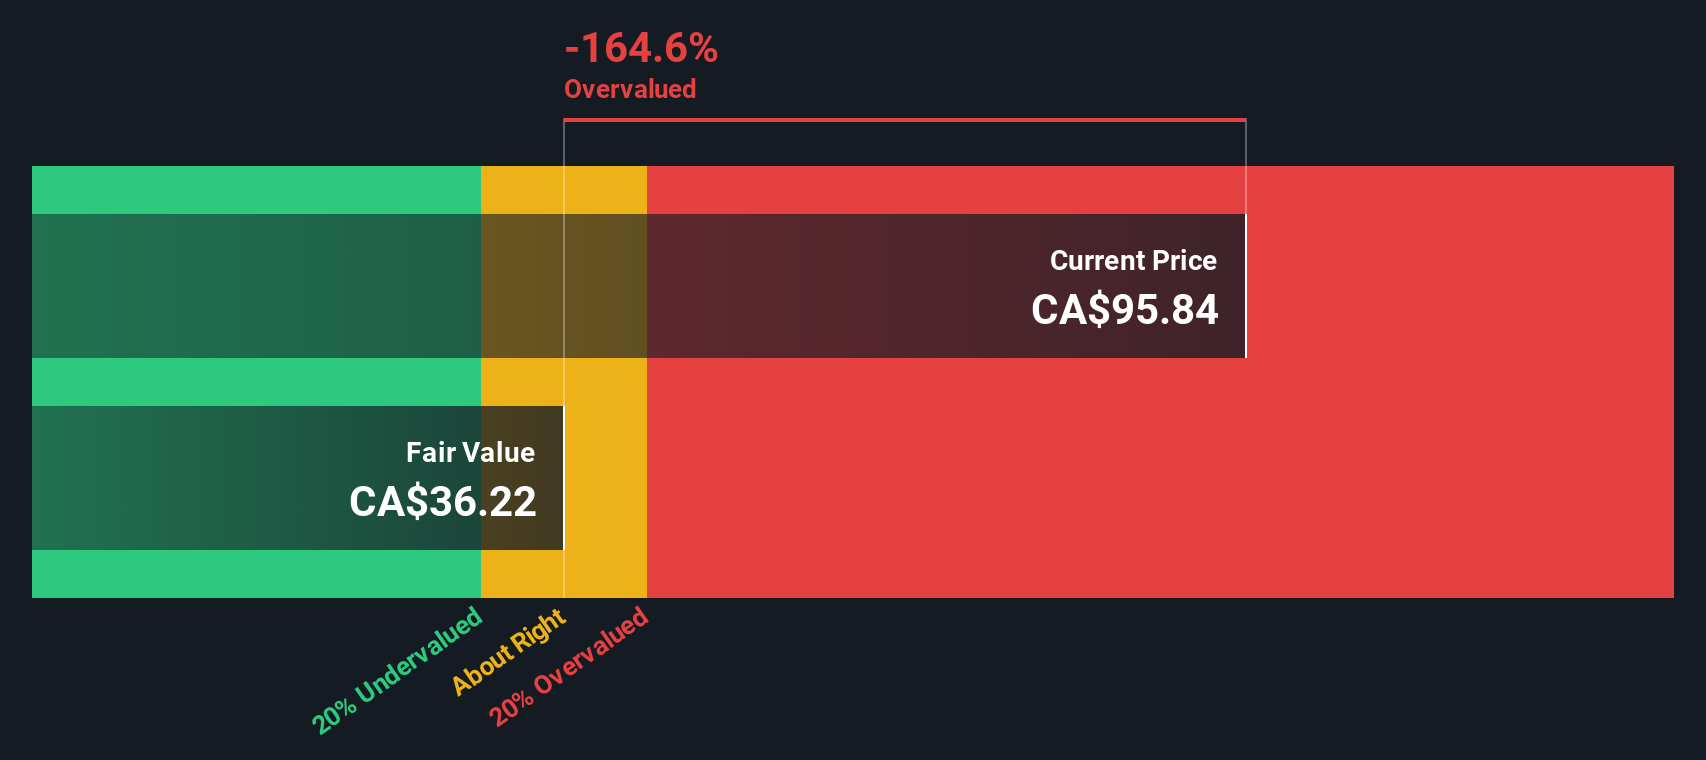
When these excess returns are projected forward and discounted, the Excess Returns valuation points to an intrinsic value of about CA$38.62 per share. With the stock trading roughly 255.2% above that estimate, this model indicates that Sprott appears significantly overvalued within this framework.
Result: OVERVALUED
Our Excess Returns analysis suggests Sprott may be overvalued by 255.2%. Discover 904 undervalued stocks or create your own screener to find better value opportunities.
Approach 2: Sprott Price vs Earnings
For a consistently profitable company like Sprott, the price to earnings, or PE, ratio is a useful way to gauge how much investors are willing to pay for each dollar of current earnings. In general, faster growing and lower risk businesses can justify a higher PE multiple, while slower growing or riskier names tend to trade on lower PE ratios.
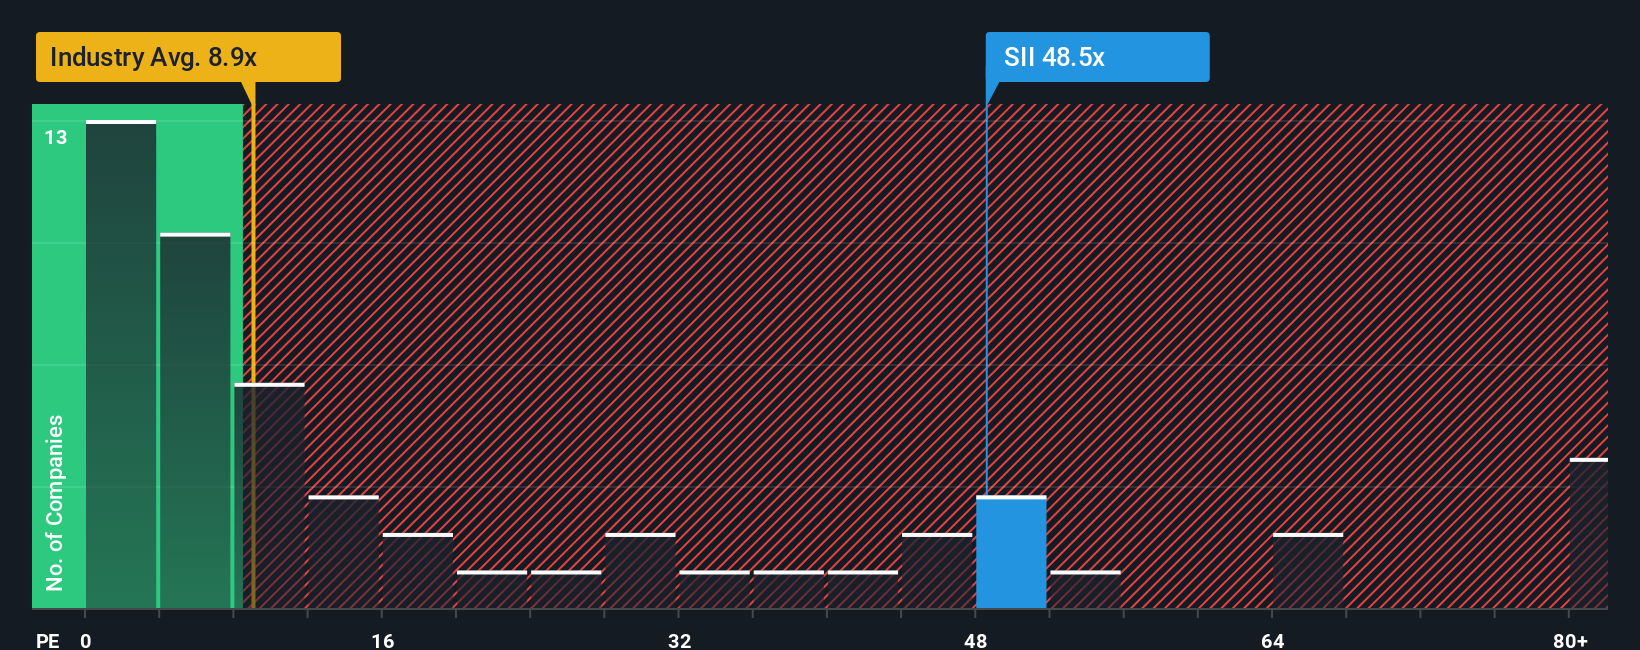
Sprott currently trades on a PE of about 51.4x, which is far richer than the wider Capital Markets industry average of around 8.6x and also well above the peer group average of roughly 24.3x. That large premium suggests the market is already baking in strong growth and a relatively resilient earnings profile.
Simply Wall St adds another layer with its Fair Ratio, a proprietary estimate of what PE multiple would be reasonable for Sprott after weighing its earnings growth outlook, risk profile, profitability, industry positioning and size. This is more informative than a simple peer or industry comparison because it adjusts for the specific strengths and vulnerabilities of the business rather than assuming all firms deserve the same multiple. On this framework, Sprott’s current 51.4x PE sits materially above its Fair Ratio, indicating the shares look overvalued on an earnings multiple basis.
Result: OVERVALUED
PE ratios tell one story, but what if the real opportunity lies elsewhere? Discover 1459 companies where insiders are betting big on explosive growth.
Upgrade Your Decision Making: Choose your Sprott Narrative
Earlier we mentioned that there is an even better way to understand valuation, so let us introduce you to Narratives, a simple way to connect your view of a company with numbers like future revenue, earnings, margins and ultimately fair value. A Narrative is essentially your investment story for Sprott, translated into a clear financial forecast, which then produces a fair value you can easily compare against today’s share price to decide whether it looks like a buy, hold, or sell. On Simply Wall St, Narratives are available on the Community page, where millions of investors share their perspectives in an accessible format that anyone can explore or build themselves, without needing to be a valuation expert. Because Narratives are updated dynamically as new information comes in, such as earnings results or major news, your fair value view stays current instead of going stale. For Sprott, one investor might build a very optimistic Narrative with higher revenue growth and margins that support a much higher fair value, while another might use more conservative assumptions that point to a lower fair value and a smaller margin of safety at the current price.
Do you think there's more to the story for Sprott? Head over to our Community to see what others are saying!

This article by Simply Wall St is general in nature. We provide commentary based on historical data and analyst forecasts only using an unbiased methodology and our articles are not intended to be financial advice. It does not constitute a recommendation to buy or sell any stock, and does not take account of your objectives, or your financial situation. We aim to bring you long-term focused analysis driven by fundamental data. Note that our analysis may not factor in the latest price-sensitive company announcements or qualitative material. Simply Wall St has no position in any stocks mentioned.
Have feedback on this article? Concerned about the content? Get in touch with us directly. Alternatively, email editorial-team@simplywallst.com