
 Nasdaq
 華爾街日報
華爾街日報Has Rivian’s Recent 59% Rally Outrun Its Fundamentals in 2025?
- Wondering whether Rivian Automotive is still a speculative story or actually starting to look like a genuine value opportunity? You are not alone; many investors are trying to figure out if the current price makes sense.
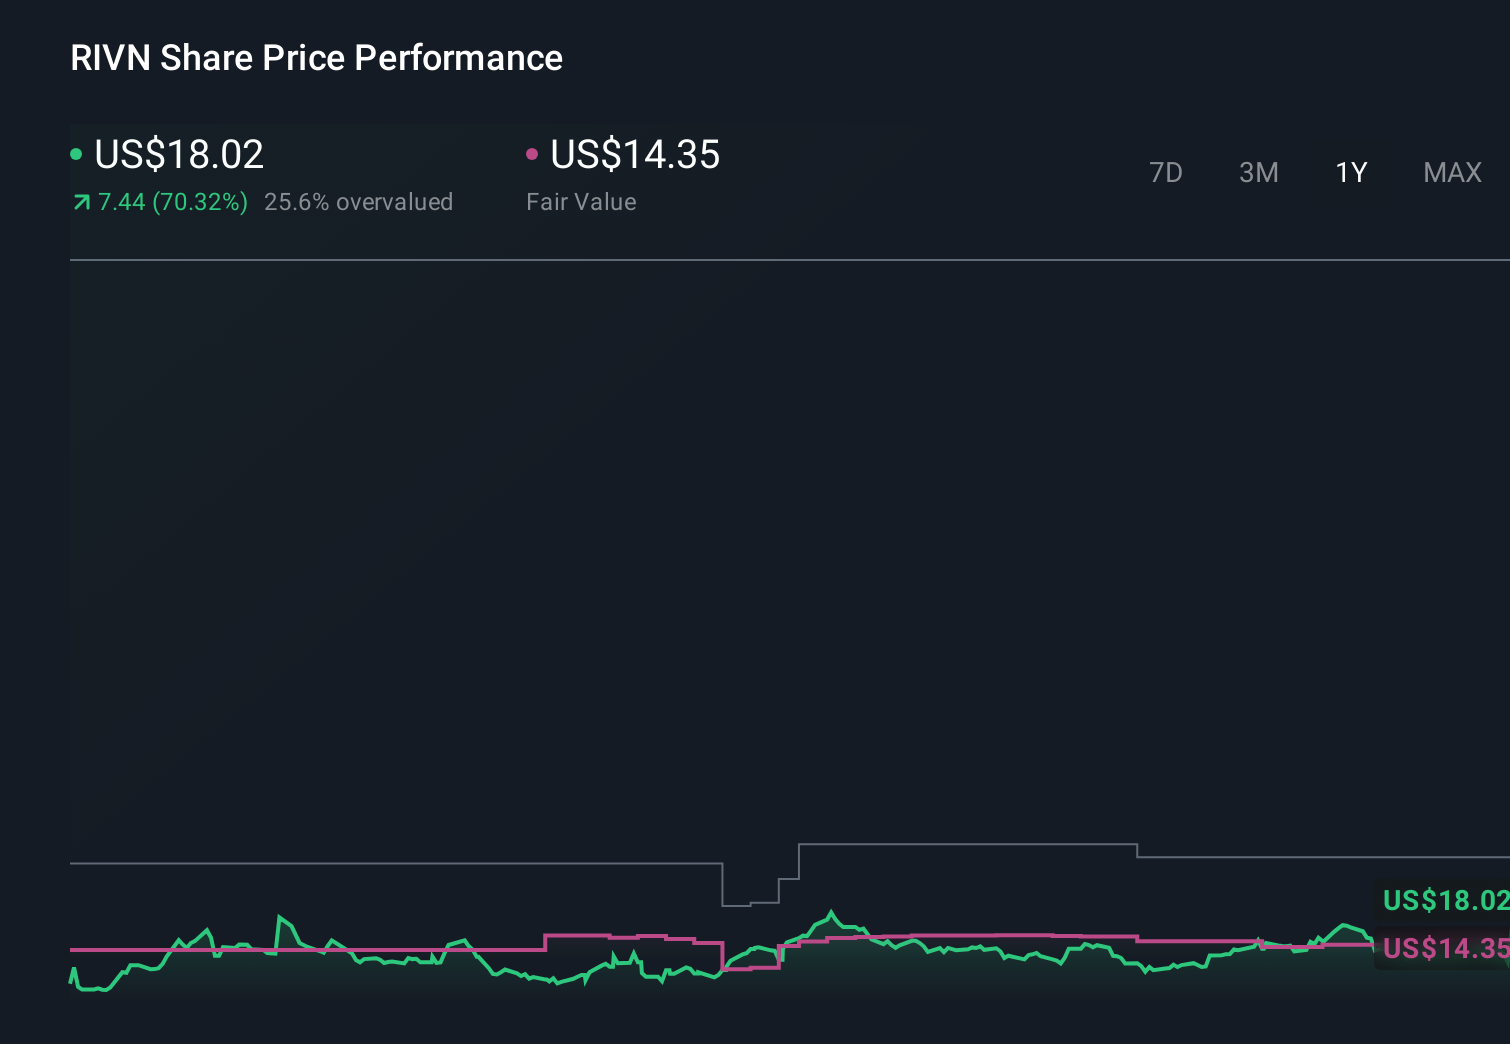
- After a volatile ride, Rivian's share price has surged 19.9% over the last week, 39.3% over the past month, and 59.5% year to date, with a 50.3% gain over the last year that signals a serious shift in sentiment.
- That renewed optimism has been fueled by steady progress on production scaling, partnerships to expand charging infrastructure, and ongoing buzz around its position in the premium EV truck and SUV niche. Together, these developments have pushed investors to reassess both Rivian's risk profile and its long term growth potential.
- Despite the strong share price recovery, Rivian currently scores just 0/6 on our valuation checks, which means it is not screening as undervalued on any of our standard metrics. Next we will walk through those valuation approaches one by one, then finish with a more holistic way to think about what Rivian might really be worth.
Rivian Automotive scores just 0/6 on our valuation checks. See what other red flags we found in the full valuation breakdown.
Approach 1: Rivian Automotive Discounted Cash Flow (DCF) Analysis
A Discounted Cash Flow, or DCF, model estimates what a company is worth today by projecting its future cash flows and then discounting them back to their present value using a required rate of return.
For Rivian Automotive, the model used is a 2 Stage Free Cash Flow to Equity approach. Rivian currently has last twelve month Free Cash Flow of about $442.1 million in the red, which highlights that the business is still investment heavy and not yet cash generative. Analyst and extrapolated projections in this model see this gradually improving, with Free Cash Flow expected to turn positive and reach roughly $1.54 billion by 2035, based on Simply Wall St extending limited analyst forecasts further into the future.
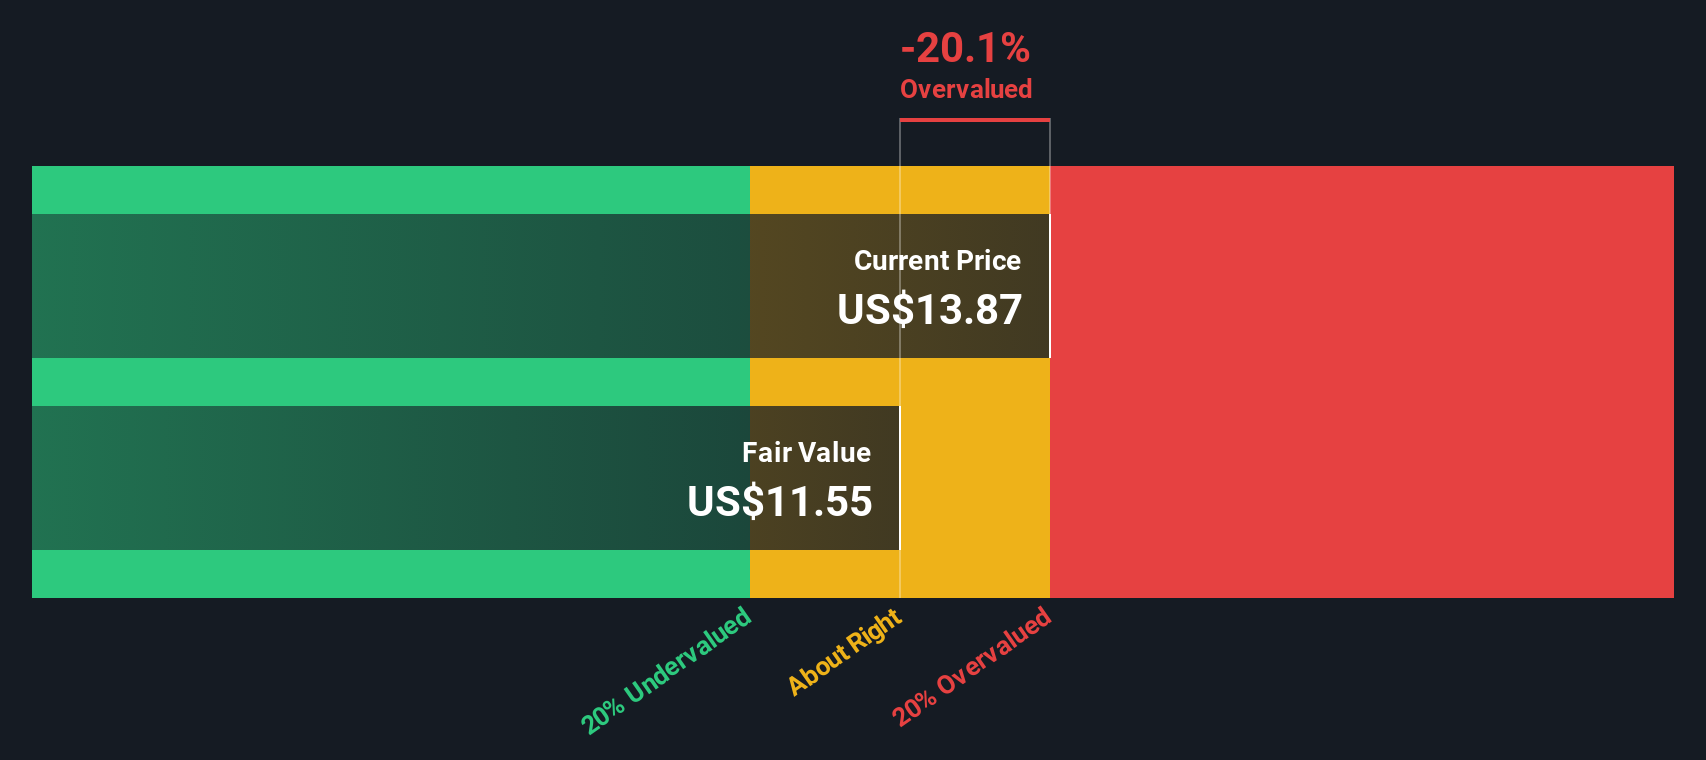
When all those projected cash flows are discounted back to today in dollars, the model arrives at an estimated intrinsic value of about $3.32 per share. Relative to the current market price in this analysis, this implies the stock is roughly 536.0% overvalued on a pure cash flow basis.
Result: OVERVALUED
Our Discounted Cash Flow (DCF) analysis suggests Rivian Automotive may be overvalued by 536.0%. Discover 905 undervalued stocks or create your own screener to find better value opportunities.
Approach 2: Rivian Automotive Price vs Sales
For companies like Rivian that are not yet consistently profitable, the Price to Sales ratio is often a more practical valuation tool than earnings based metrics. Sales are harder to manipulate, and for high growth, loss making businesses, investors typically anchor on revenue scale and growth as the primary drivers of long term value.
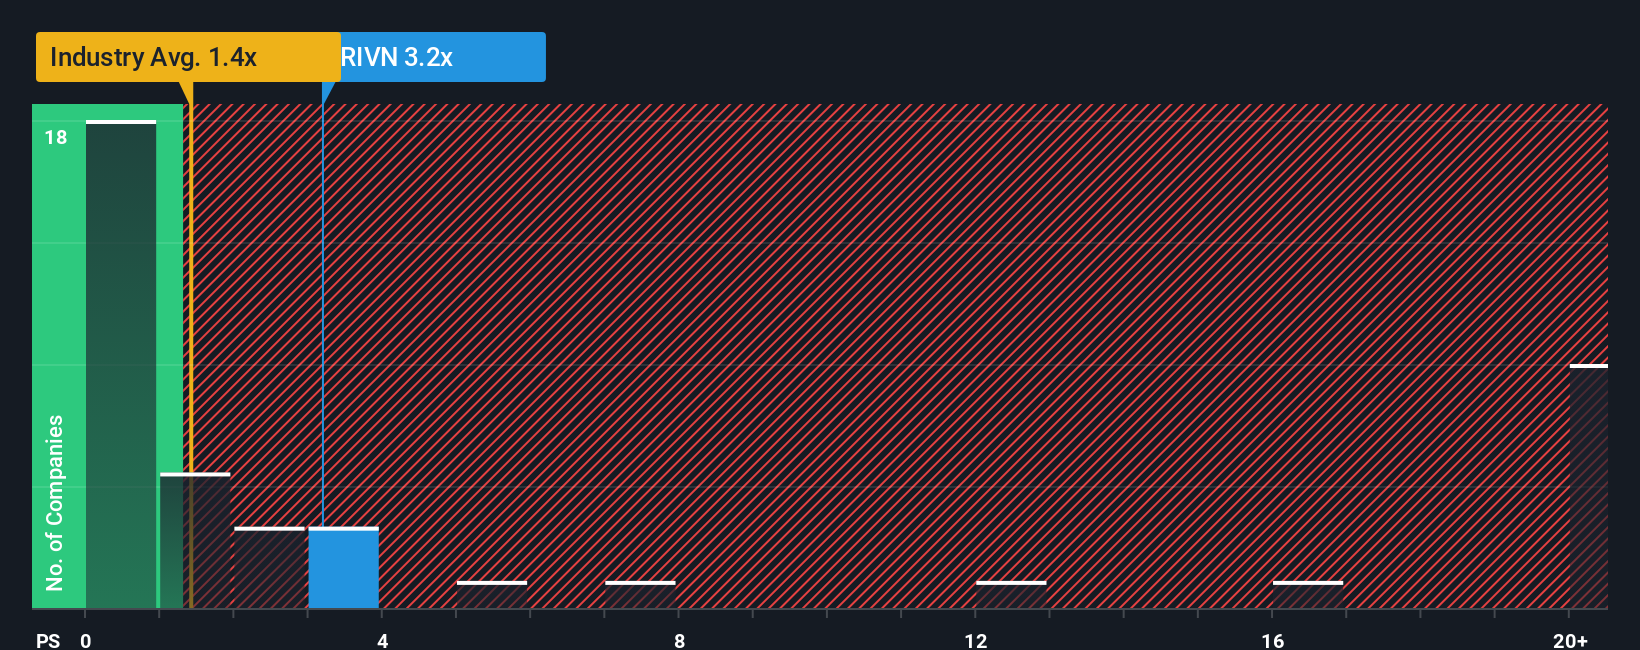
In general, higher growth and lower perceived risk justify a higher Price to Sales multiple, while slower growth, thinner margins, or execution risks argue for a lower one. Rivian currently trades on a Price to Sales ratio of about 4.44x, which is well above the wider Auto industry average of roughly 0.60x and also ahead of its peer group, which sits around 1.15x.
Simply Wall St also uses a proprietary “Fair Ratio” framework, which estimates what Rivian’s Price to Sales multiple should be given its growth outlook, industry, profit margins, market cap and specific risks. This Fair Ratio for Rivian is 1.22x, notably below the current 4.44x. Because this approach adjusts for company specific fundamentals rather than relying only on blunt peer or industry comparisons, it offers a more nuanced view, and on that basis Rivian still appears priced well above what its fundamentals currently support.
Result: OVERVALUED
PS ratios tell one story, but what if the real opportunity lies elsewhere? Discover 1459 companies where insiders are betting big on explosive growth.
Upgrade Your Decision Making: Choose your Rivian Automotive Narrative
Earlier we mentioned that there is an even better way to understand valuation, so let us introduce you to Narratives. This is a simple way to write the story you believe about Rivian, translate that story into assumptions for revenue, earnings and margins, and then link those assumptions to a fair value estimate that you can compare against today’s share price to decide whether to buy, hold or sell. All of this is available within an easy to use tool on Simply Wall St’s Community page that millions of investors already engage with. The tool automatically updates your fair value whenever new information like earnings or major news is released. For example, one Rivian Narrative might lean bullish and land near a $21 fair value based on strong R2 adoption, rising software margins and sustained EV demand. Another more cautious Narrative could anchor closer to $7.55, assuming slower growth, weaker incentives and persistent cash burn. Both perspectives are made explicit through the numbers behind each story so you can see how different expectations create very different valuations.
Do you think there's more to the story for Rivian Automotive? Head over to our Community to see what others are saying!
This article by Simply Wall St is general in nature. We provide commentary based on historical data and analyst forecasts only using an unbiased methodology and our articles are not intended to be financial advice. It does not constitute a recommendation to buy or sell any stock, and does not take account of your objectives, or your financial situation. We aim to bring you long-term focused analysis driven by fundamental data. Note that our analysis may not factor in the latest price-sensitive company announcements or qualitative material. Simply Wall St has no position in any stocks mentioned.
Have feedback on this article? Concerned about the content? Get in touch with us directly. Alternatively, email editorial-team@simplywallst.com